
UI for WinUI
WinUI BulletGraph
- Best in class WinUI BulletGraph control for creating lightweight, highly customizable, and information-heavy dashboards.
- Part of the professionally-designed Telerik UI for WinUI library controls.
- Includes support, documentation, demos, Visual Studio Extensions and more!
-
Overview
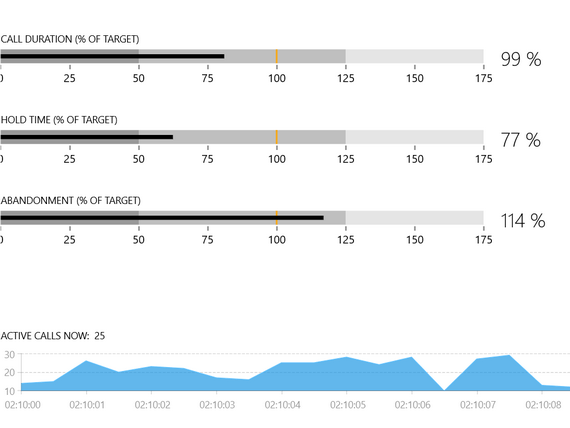
The Telerik BulletGraph for WinUI control serves as a replacement for dashboard gauges and meters, which typically don’t display enough information, require too much space, and can be cluttered with useless and distracting decorations. The BulletGraph features a single measure compared to one or more other measures to enrich its meaning (for example, compared to a target) and displays results in the context of qualitative ranges of performance, such as poor, satisfactory, and good.
-
Featured Measure
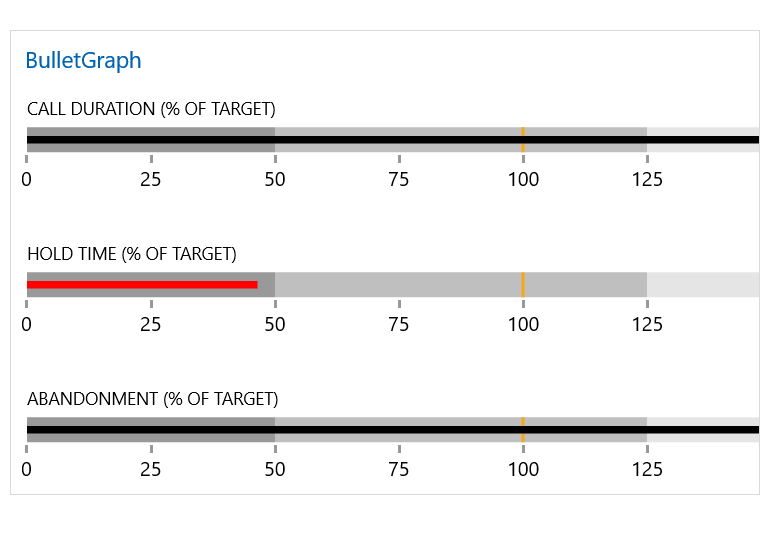
The Telerik BulletGraph for WinUI allows the representation of progress as a featured measure.
Visit the Featured Measure section in the Telerik BulletGraph for WinUI documentation -
Comparative Measure
The comparative measure feature for the WinUI BulletGraph control allows you to visualize an indicator for a certain threshold.
Visit the Comparative Measure section in the Telerik BulletGraph for WinUI documentation -
Customizable Ticks and Lables
-
Data Binding Support
The control can be easily bound to your business data, either by setting its properties directly or using a binding declaration.
Check out the Telerik WinUI demos -
Fully Customizable Styling and Appearance
The BulletGraph for WinUI is fully customizable to be adjusted to your business' needs and requirements.
Visit the Telerik BulletGraph for WinUI documentation for more information
