UI for WinUI
WinUI Chart
- Best in class WinUI Chart component analyzes complex information organized in hierarchies, coordinate systems, and data points.
- Part of the professionally-designed Telerik UI for WinUI library controls.
- Includes support, documentation, demos, Visual Studio Extensions and more!
-
Overview
The Chart control for WinUI is a versatile charting component that has been specifically designed from the ground-up with the latest Windows patterns and practices in mind. The Telerik Chart for WinUI offers unmatched performance for loading time, drawing capabilities, and real-time updates. Its intuitive object model and public API allow complex charts to be easily set up either in XAML or in code-behind. Chart types (or series) are organized in hierarchies, depending on the coordinate system, used to plot data points
Visit the Telerik Chart for WinUI documentation for more information on how to get started with the control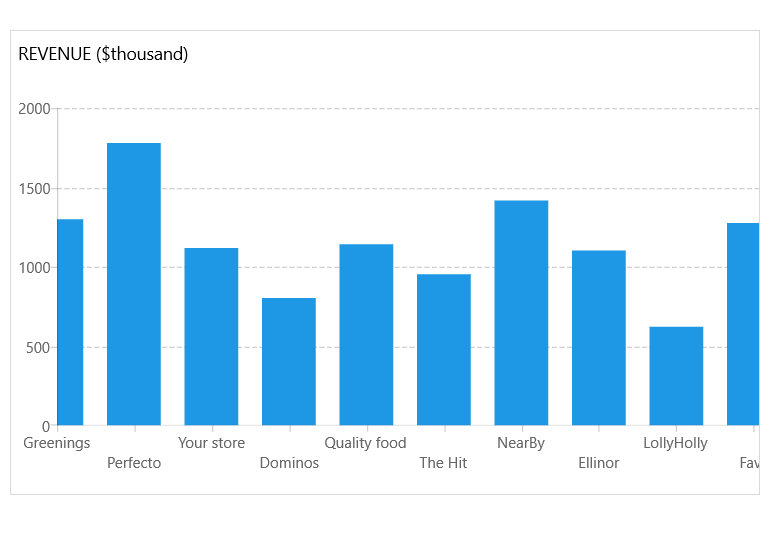
-
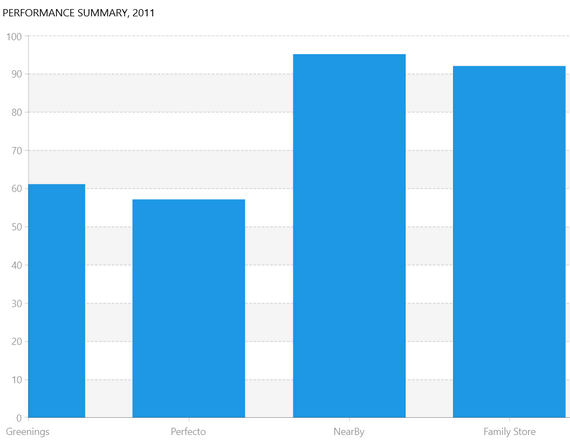
Rich, Powerful Charts for building Next-Generation Windows Apps
The Telerik Chart control for WinUI features a rich set of chart series from Bar, Line, Area, Pie, etc., to different financial series. The control is optimized for performance on any device and screen size running Windows 10. The rich public API allows customizing the Chart control to the smallest detail.
Visit the Telerik Chart for WinUI documentation for more information -
Financial Series and Indicators
The Chart for building WinUI desktop applications supports Candle and OHLC (Open High Low Close) series. These series operate with special data points, which hold information about each of the following parameters: open, high, low, close, and instrumental for financial application use cases.
Visit the Telerik Chart for WinUI documentation for more information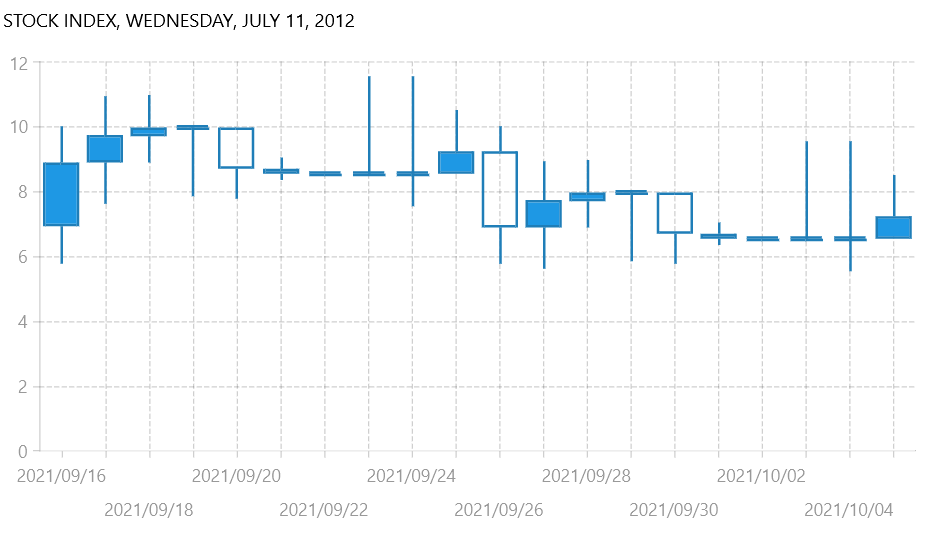
-
Visualize Multiple Data Series in a Single Chart
Thanks to the Multi-Axis support, you can display several data series based on multiple parameters in a single chart, e.g., you can contrast a set of countries based on their population, size, and per-capita income.
Check out the Telerik WinUI demos -
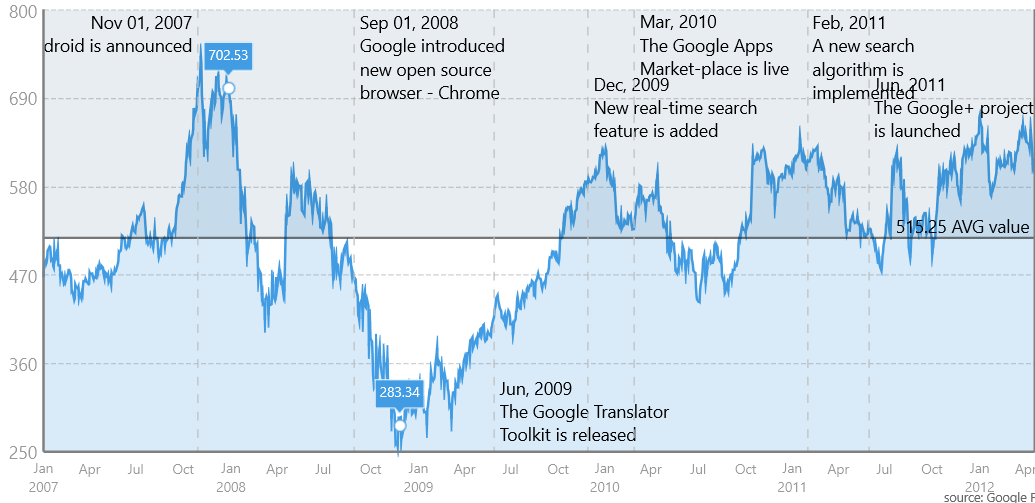
Chart Annotations
Annotations allow making notes of trends or observations on your charts. Annotations are visual elements that you can attach to a specific data point, plot area or define them in your custom way.
-
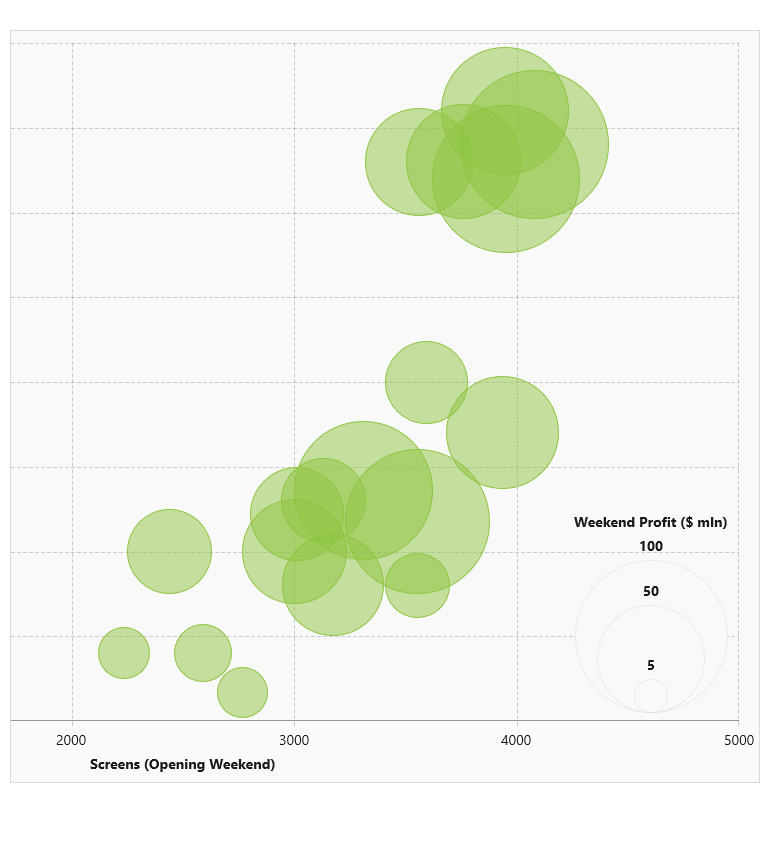
Chart: New Bubble Series Visualization
The new BubbleSeries and ScatterBubbleSeries allow you to display three-dimensional data, where each entry in the data set is represented by a bubble shape. The first two dimensions represent the position of the bubble in the Cartesian coordinate system. The third one is the size of the bubble, which is proportional to the plotted values.
-
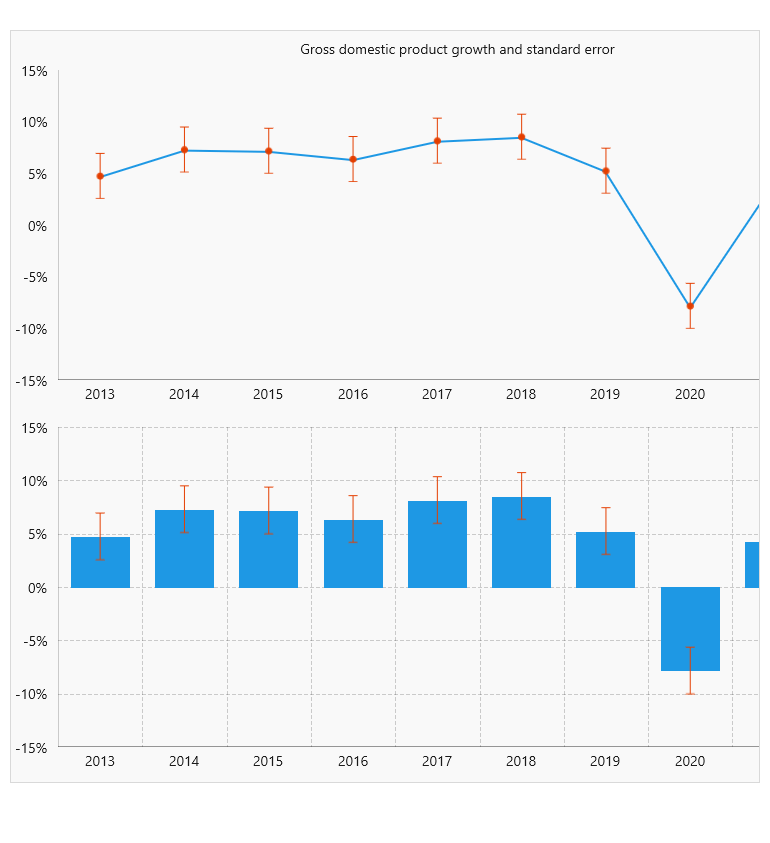
ErrorBar Series
The error bar shape allows you to display an error or uncertainty in the plotted data. The shape consists of a single line with caps at the two ends. Additionally, the series allows displaying expected measures thanks to an additional marker.
-
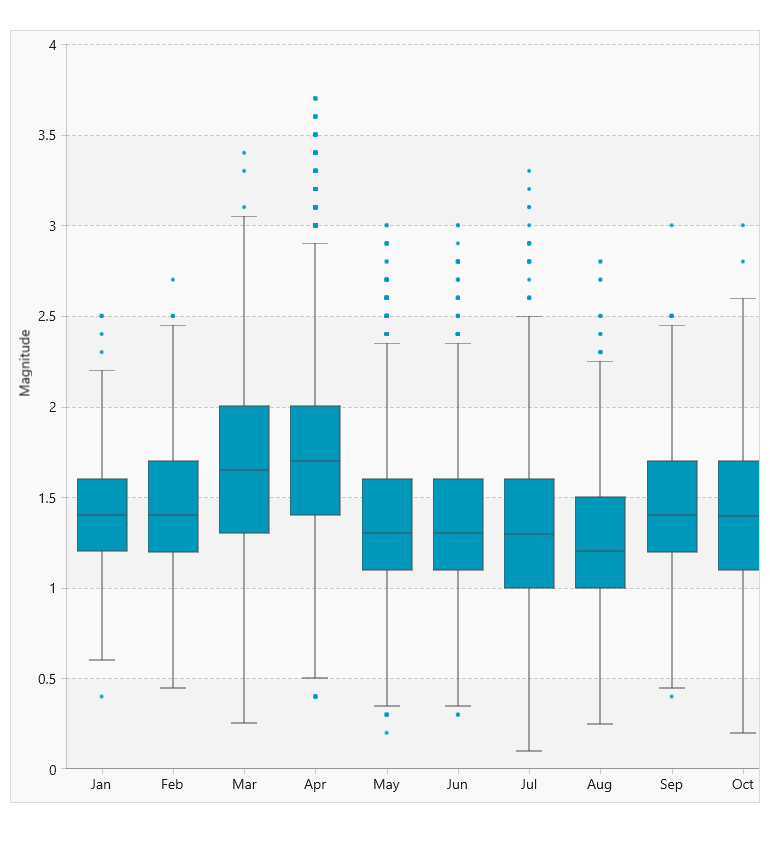
BoxPlot Series
This type of series visualizes its data points using box plot shapes. An alternative name for this visualization is box and whiskers. The box plot shape allows displaying summarized information containing five values: minimum, maximum, lower quartile (Q1), upper quartile (Q3) and median, plotted on the numeric axis of the chart.
-
Spline Series
The SplineSeries are represented on the chart as data points connected with smooth line segments. The spline-type series provide options to control the additional points calculated for the spline of the line. You can control the tension and smoothness of the spline.