Series Overview
RadChart has been deprecated since Q3 2014 and is marked as obsolete as of the 2026 Q2 SP1 (v2026.2.708) release. This is the last release that includes the RadChart component — its source code will be removed from the assembly in the next release. We strongly recommend using RadHtmlChart, Telerik's modern client-side charting component. To transition from RadChart to RadHtmlChart, refer to the following migration articles:
Explore the RadHtmlChart documentation and online demos to determine how it fits your development needs.
Series refers to a series of data points displayed in the chart. The RadChart Series object is a collection of ChartSeriesItem objects. The number of series used depends on the type of chart. A Pie chart type only uses a single series. "Stacked" charts like the Stacked Area chart use several series.
Each ChartSeries object contains a collection of ChartSeriesItem objects that contain the actual data points displayed on the chart. You can add data to a series programmatically at run time, at design time in the Properties Window of Visual Studio, declaratively in the ASP.NET HTML markup, or by binding to a data source.
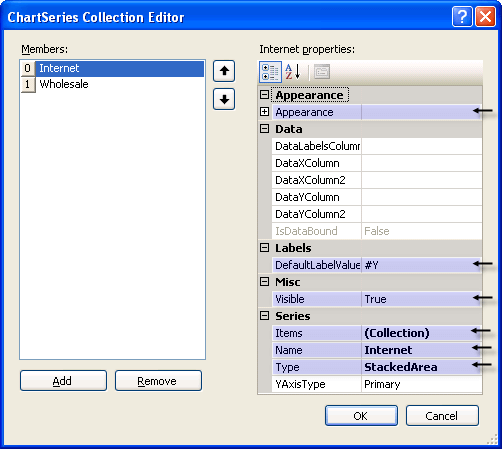
Some key properties for the ChartSeries are:
-
Appearance: This property contains the common appearance related properties such as Border, Corners, FillStyle and TextAppearance.In addition there are series specific properties including LabelAppearance, LineSeriesAppearance, LegendDisplayMode, BubbleSize and PointMark.
-
DefaultLabelValue: Specifies a format for label values. This allows you to display data points as numeric amounts, percentages, totals or any format described in this MSDN article Standard Numeric Format Strings
-
Items: The collection of ChartSeriesItem objects that contain data points.
-
Name: By default this name is displayed in the legend for the series.
-
Types: Use this property to select the chart type.Valid values are Bar, StackedBar, StackedBar100, Line, Area, StackedArea, StackedArea100, Pie, Gantt, Bezier, Spline, Bubble, Point, SplineArea, StackedSplineArea and StackedSplineArea100.
-
Visible: Turn this property off to hide the series.
ChartSeries Properties Used in Data Binding
DataLabelsColumn: This is the name of a data source column that will supply the text that displays next to each data point in the chart.DataXColumn, DataXColumn2, DataYColumn, DataYColumn2: These are the names of the columns that will contain data used for the series item XValue, XValue2, YValue and YValue2 columns respectively.