Bubble Charts
RadChart has been deprecated since Q3 2014 and is no longer recommended for use, as it does not support modern browsers. We strongly recommend using RadHtmlChart, Telerik's modern client-side charting component. To transition from RadChart to RadHtmlChart, refer to the following migration articles:
Explore the RadHtmlChart documentation and online demos to determine how it fits your development needs.
The Bubble chart is an extension of the Point chart but each point can be a circle or oval of any size or dimension. Instead of using just the XValue and YValue, the Bubble chart uses XValue/XValue2, and YValue/YValue2 pairs to define the dimensions of each bubble. Bubble charts are commonly used to display financial information where the size of the bubble can be proportionate to the data values.
To change the size of all bubbles in a series, but to not distort the dimensions of the bubble, assign the Series.Appearance.BubbleSize property.
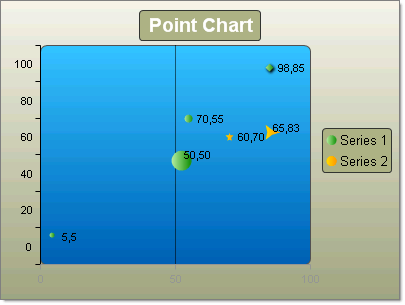
To create a vertical Bubble Chart set the SeriesOrientation property to Vertical. Set the RadChartDefaultType property or ChartSeries.Type Bubble. Add one or more chart series to the Series collection. Add one or more chart items to the series Items collection. Populate numeric values for XValue, XValue2, YValue and YValue2 properties of each chart series item.
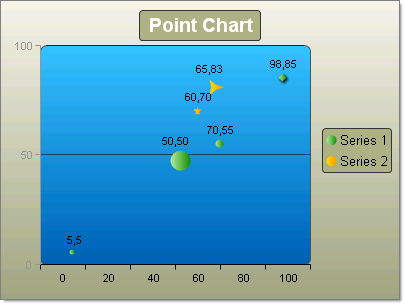
To create a horizontal Bubble Chart set the SeriesOrientation property to Horizontal. Set the RadChart DefaultType property or ChartSeries.Type Bubble. Add one or more chart series to the Series collection. Add one or more chart items to the series Items collection. Populate numeric values for XValue, XValue2, YValue and YValue2 properties of each chart series item.