Migrate Data Binding Configuration
This article illustrates how to migrate the configuration of data binding with discrete and continuous data from RadChart to the ASP.NET AJAX Chart. The examples illustrate how to migrate the data binding declaratively. However, you can use the same classes and properties of the series and axis to programmatically migrate the configuration of the data binding.
Data Binding Discrete Data
Data Binding Discrete Data in RadChart
Data-bound specific properties in RadChart are configured in the following objects:
-
XAxis - The object holds the corresponding x-axis related property - DataLabelsColumn.
-
ChartSeries - The object holds the corresponding y-axis related properties - DataYColumn, DataYColumn2, DataYColumn3 and DataYColumn4.
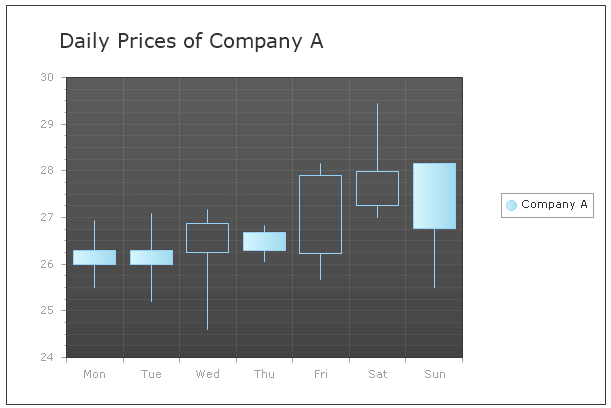
The code in Example 1 illustrates how to bind discrete data in a Candlestick series with RadChart and is shown in Figure 1.
Figure 1: Display data-bound discrete data in a Candlestick series with RadChart.

Example 1: Configuring data binding of discrete data in a Candlestick series with RadChart.
<telerik:RadChart ID="RadChart1" runat="server" Width="600px" Height="400px">
	<Series>
		<telerik:ChartSeries Type="CandleStick" DataYColumn="OpenField" DataYColumn3="HighField" DataYColumn4="LowField" DataYColumn2="CloseField" Name="Company A">
			<Appearance>
				<LabelAppearance Visible="false"></LabelAppearance>
			</Appearance>
		</telerik:ChartSeries>
	</Series>
	<PlotArea>
		<XAxis DataLabelsColumn="DayField"></XAxis>
		<YAxis MinValue="24" MaxValue="30" AutoScale="false"></YAxis>
	</PlotArea>
	<ChartTitle TextBlock-Text="Daily Prices of Company A"></ChartTitle>
</telerik:RadChart>Data Binding Discrete Data in RadHtmlChart
Data-bound specific properties in RadHtmlChart are configured in the following objects:
-
XAxis - The object holds the corresponding x-axis related property - DataLabelsField.
-
[Series Type] - The object holds the corresponding y-axis related properties. RadHtmlChart exposes specific data-bound properties for each series type, which makes the configuration much easier and intuitive. Table 1 lists the corresponding data-bound properties for each category series type.
Table 1: List of data-bound properties for the corresponding category series types.
| Series Type | Series Data-bound Properties |
|---|---|
| Bar, Column, Area, Line | DataFieldY |
| Candlestick | DataOpenField, DataHighField, DataLowField, DataCloseField |
| Pie | DataFieldY |
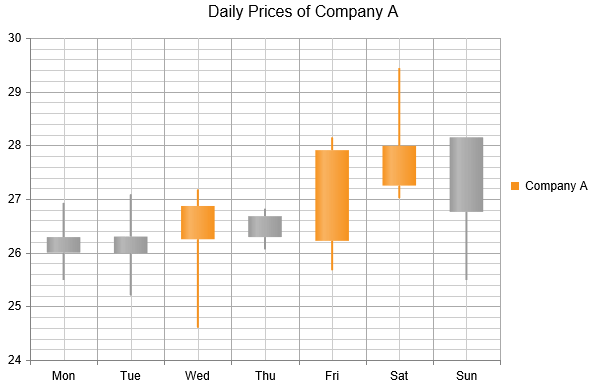
The code in Example 2 illustrates how to bind discrete data in a Candlestick series with RadHtmlChart in Figure 2.
Figure 2: Display data-bound discrete data in a Candlestick series with RadHtmlChart.

Example 2: Configuring data binding of discrete data in a Candlestick series with RadHtmlChart.
<telerik:RadHtmlChart ID="RadHtmlChart1" runat="server" Width="600px" Height="400px">
	<PlotArea>
		<Series>
			<telerik:CandlestickSeries DataOpenField="OpenField" DataHighField="HighField" DataLowField="LowField" DataCloseField="CloseField" Name="Company A"></telerik:CandlestickSeries>
		</Series>
		<XAxis DataLabelsField="DayField"></XAxis>
		<YAxis MinValue="24" MaxValue="30"></YAxis>
	</PlotArea>
	<ChartTitle Text="Daily Prices of Company A"></ChartTitle>
</telerik:RadHtmlChart>Data Binding Continuous Data
Data Binding Continuous Data in RadChart
Data-bound specific properties in RadChart are configured in the ChartSeries object:
-
The corresponding x-axis related properties are DataXColumn and DataXColumn2.
-
The corresponding y-axis related properties are DataYColumn, DataYColumn2, DataYColumn3 and DataYColumn4.
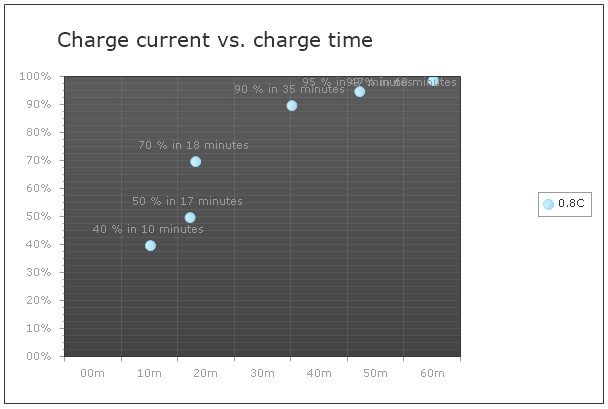
The code in Example 3 illustrates how to bind continuous data in a Point series with RadChart and is shown in Figure 3.
Figure 3: Display data-bound continuous data in a Point series with RadChart.

Example 3: Configuring data binding of continuous data in a Point series with RadChart.
<telerik:RadChart ID="RadChart1" runat="server" Width="600px" Height="400px">
	<Series>
		<telerik:ChartSeries Type="Point" DataXColumn="xField" DataYColumn="yField" Name="0.8C" DefaultLabelValue="#Y{P0} in #X minutes">
		</telerik:ChartSeries>
	</Series>
	<PlotArea>
		<XAxis Appearance-CustomFormat="0#m"></XAxis>
		<YAxis Appearance-CustomFormat="0#%"></YAxis>
	</PlotArea>
	<ChartTitle TextBlock-Text="Charge current vs. charge time"></ChartTitle>
</telerik:RadChart>Data Binding Continuous Data in RadHtmlChart
Data-bound specific properties in RadHtmlChart are configured in the [Series Type] object. The series object holds the corresponding x-axis and y-axis related properties. RadHtmlChart exposes specific data-bound properties for each series type, which makes the configuration much easier and intuitive. Table 2 lists the corresponding data-bound properties for each numeric series type.
Table 2: List of data-bound properties for the corresponding numeric series types.
| Series Type | Series Data-bound Properties |
|---|---|
| Scatter, ScatterLine | DataFieldY, DataFieldX |
| Bubble | DataFieldY, DataFieldX, DataFieldSize, DataFieldTooltip |
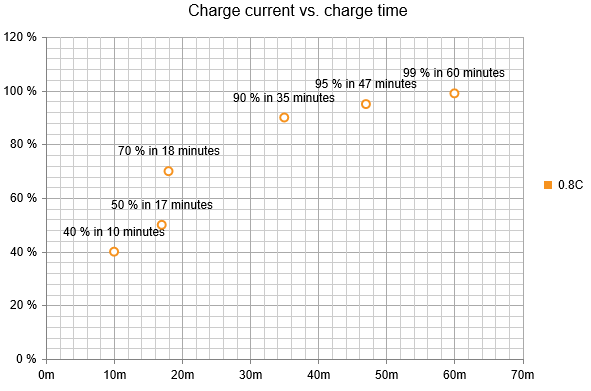
The code in Example 4 illustrates how to bind continuous data in a Scatter series with RadHtmlChart as shown in Figure 4.
Figure 4: Display data-bound continuous data in a Scatter series with RadHtmlChart.

Example 4: Configuring data binding of continuous data in a Scatter series with RadHtmlChart.
<telerik:RadHtmlChart ID="RadHtmlChart1" runat="server" Width="600px" Height="400px">
	<PlotArea>
		<Series>
			<telerik:ScatterSeries DataFieldX="xField" DataFieldY="yField" Name="0.8C">
				<LabelsAppearance DataFormatString="{1:P0} in {0} minutes"></LabelsAppearance>
			</telerik:ScatterSeries>
		</Series>
		<XAxis>
			<LabelsAppearance DataFormatString="{0}m"></LabelsAppearance>
		</XAxis>
		<YAxis>
			<LabelsAppearance DataFormatString="{0:P0}"></LabelsAppearance>
		</YAxis>
	</PlotArea>
	<ChartTitle Text="Charge current vs. charge time"></ChartTitle>
</telerik:RadHtmlChart>