Stacked Bar Charts
RadChart has been deprecated since Q3 2014 and is no longer recommended for use, as it does not support modern browsers. We strongly recommend using RadHtmlChart, Telerik's modern client-side charting component. To transition from RadChart to RadHtmlChart, refer to the following migration articles:
Explore the RadHtmlChart documentation and online demos to determine how it fits your development needs.
Stacked bar charts are used to compare contributions of values to a total across categories. In the examples below the categories are various sources for sales (Internet, Wholesale, Retail) that combine to make the total sales for each quarter. Use the Stacked Bar chart when you need visibility to the combined values for each category.
To create a Vertical Stacked Bar Chart set the SeriesOrientation property to Vertical. Set the RadChartDefaultType property or ChartSeries.Type to StackedBar.

To create a Horizontal Stacked Bar Chart set the SeriesOrientation property to Horizontal. Set the RadChartDefaultType property or ChartSeries.Type to StackedBar.
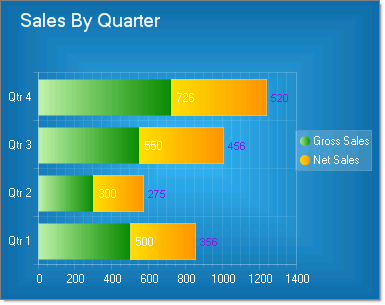
To display custom labelling on the X-Axis "Qtr 1", "Qtr 2", etc., set the RadChart PlotArea.XAxis property and for each item set the TextBlock Text property to the desired label.