Bezier Charts
RadChart has been deprecated since Q3 2014 and is no longer recommended for use, as it does not support modern browsers. We strongly recommend using RadHtmlChart, Telerik's modern client-side charting component. To transition from RadChart to RadHtmlChart, refer to the following migration articles:
Explore the RadHtmlChart documentation and online demos to determine how it fits your development needs.
The Bezier chart is often used for modelling data by interpolating data points, through which curved lines pass.
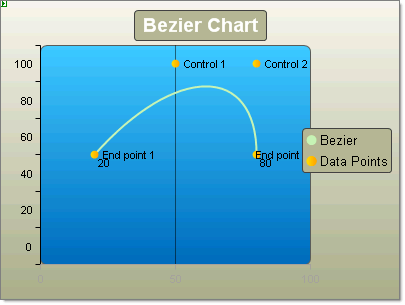
To draw a Bezier chart series you add (1 + 3 x N) items to a series. So you can have 4 data points or 7, 10, 13, etc. The simplest set of data would be 4 data points: two end points and two "control points" that control the position and amount of curvature in the line between the two end points. See the figures below for examples. Each of the data points must have a X and Y value.
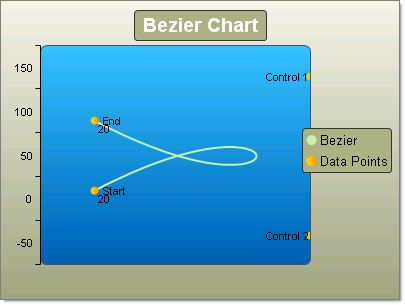
To create a simple vertical Bezier Chart set the SeriesOrientation property to Vertical. Set the RadChart DefaultType property or ChartSeries.Type to Bezier. Create a series and add four chart items with X and Y values.
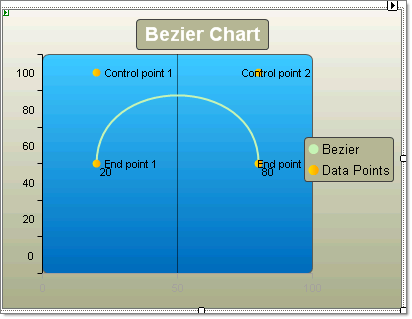
The second chart series labeled "Data Points" is included to emphasize the location of the end and control points in the Bezier series.
To create a simple horizontal Bezier Chart set the SeriesOrientation property to Horizontal. Set the RadChart DefaultType property or ChartSeries.Type to Bezier. Create a series and add four chart items with X and Y values.
| YValue | XValue |
|---|---|
| 20 | 50 |
| 20 | 100 |
| 80 | 100 |
| 80 | 50 |
| YValue | XValue |
|---|---|
| 20 | 50 |
| 50 | 100 |
| 80 | 100 |
| 80 | 50 |