Spline Charts
RadChart has been deprecated since Q3 2014 and is no longer recommended for use, as it does not support modern browsers. We strongly recommend using RadHtmlChart, Telerik's modern client-side charting component. To transition from RadChart to RadHtmlChart, refer to the following migration articles:
Explore the RadHtmlChart documentation and online demos to determine how it fits your development needs.
Spline charts allow you to take a limited set of known data points and approximate intervening values. In practice you define a series of chart items with X/Y values and RadChart does the rest.
To create a simple vertical Spline Chart set the SeriesOrientation property to Vertical. Set the RadChart DefaultType property or ChartSeries.Type to Spline. Create a series and add chart items with Y or X and Y values.

To create a simple horizontal Spline Chart set the SeriesOrientation property to Horizontal. Set the RadChart DefaultType property or ChartSeries.Type to Spline. Create a series and add 3 or more chart items with X and Y values.
| YValue | XValue |
|---|---|
| 20 | 50 |
| 50 | -10 |
| 70 | 100 |
| 80 | 50 |

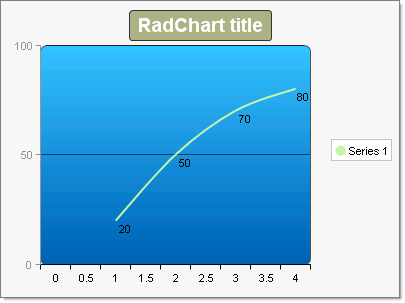
Another example showing the same Y data points as above, but with no X values defined displays an automatic even progression over the X axis.
| YValue |
|---|
| 20 |
| 50 |
| 70 |
| 80 |