Bar Charts
RadChart has been deprecated since Q3 2014 and is no longer recommended for use, as it does not support modern browsers. We strongly recommend using RadHtmlChart, Telerik's modern client-side charting component. To transition from RadChart to RadHtmlChart, refer to the following migration articles:
Explore the RadHtmlChart documentation and online demos to determine how it fits your development needs.
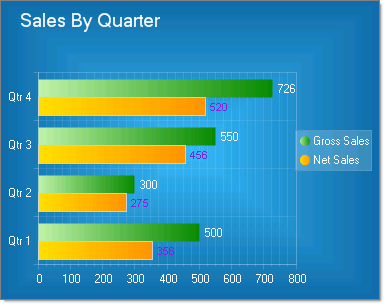
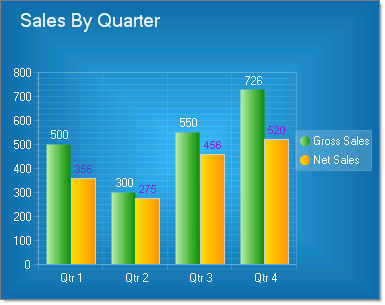
Bar charts graphically summarize and display categories of data and let the user easily compare amounts or values between different categories. Bar charts are useful for comparing multiple series of data (i.e. providing snapshots of data at particular points in time).In the examples below the categories are various sources for sales (Internet, Wholesale, Retail) that combine to make the total sales for each quarter. RadChart automatically displays each series in a different color to make them easier to distinguish.
To create a Vertical Bar Chart set the SeriesOrientation property to Vertical. Set the RadChart DefaultType property or ChartSeries.Type to Bar.
To create a Horizontal Bar Chart set the SeriesOrientation property to Horizontal. Set the RadChart DefaultType property or ChartSeries.Type to Bar.