Area Charts
RadChart has been deprecated since Q3 2014 and is no longer recommended for use, as it does not support modern browsers. We strongly recommend using RadHtmlChart, Telerik's modern client-side charting component. To transition from RadChart to RadHtmlChart, refer to the following migration articles:
Explore the RadHtmlChart documentation and online demos to determine how it fits your development needs.
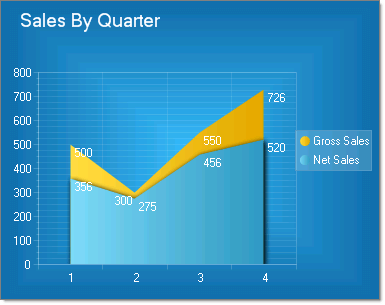
The Area chart consists of a series of data points joined by a line and where the area below the line is filled. Area charts are appropriate for visualizing data that fluctuates over a period of time and can be useful for emphasizing trends.Note: Values that don't vary too wildly work best for area charts.
Area charts display series in the order they are added, back-to-front.Depending on the Skin used, RadChart can automatically differentiate each series by displaying it in a different color. The appearance for each series can also be modified directly.
To create a Vertical Area Chart set the SeriesOrientation property to Vertical. Set the RadChart DefaultType property or ChartSeries.Type to Area.
To create a Horizontal Area Chart set the SeriesOrientation property to Horizontal. Set the RadChart DefaultType property or ChartSeries.Type to Area.
