Stacked Bar 100% Charts
RadChart has been deprecated since Q3 2014 and is no longer recommended for use, as it does not support modern browsers. We strongly recommend using RadHtmlChart, Telerik's modern client-side charting component. To transition from RadChart to RadHtmlChart, refer to the following migration articles:
Explore the RadHtmlChart documentation and online demos to determine how it fits your development needs.
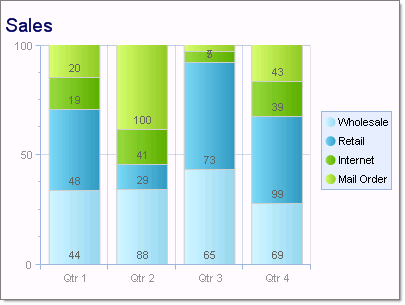
Stacked Bar 100 charts are used when you have three or more data series and want to compare distributions within categories, and at the same time display the differences between categories. Each bar represents 100% of the amounts for that category.
To create a Vertical Stacked Bar 100 Chart set the SeriesOrientation property to Vertical. Set the RadChart DefaultType property or ChartSeries.Type to StackedBar100.
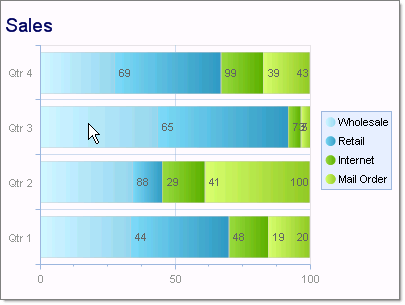
To create a Horizontal Stacked Bar Chart set the SeriesOrientation property to Horizontal. Set the RadChart DefaultType property or ChartSeries.Type to StackedBar100.
To display the label values as percentages, change the DefaultLabelValue for each chart series from "#Y" (the numeric value for each data point) to "#%" (the percentage of each data point to the category).