Gantt Charts
RadChart has been deprecated since Q3 2014 and is no longer recommended for use, as it does not support modern browsers. We strongly recommend using RadHtmlChart, Telerik's modern client-side charting component. To transition from RadChart to RadHtmlChart, refer to the following migration articles:
Explore the RadHtmlChart documentation and online demos to determine how it fits your development needs.
Gantt charts help visualize time based information. Gantt charts, also known as Time charts, display separate events, with a beginning and an end. These charts are often used for project/time planning, where data can be plotted using a date-time scale or a numerical scale.
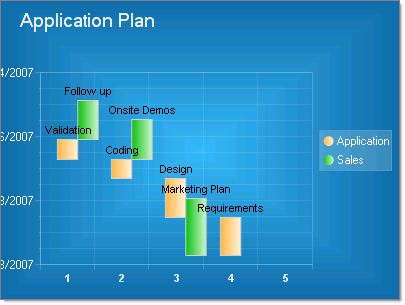
To create a vertical Gantt Chart set the SeriesOrientation property to Vertical. Set the RadChart DefaultType property or ChartSeries.Type to Gantt.
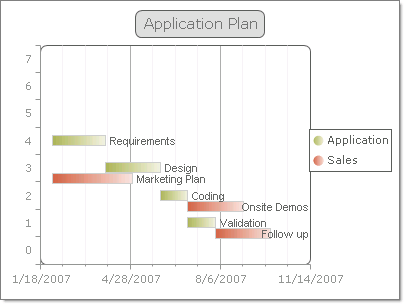
To create a horizontal Gantt Chart set the SeriesOrientation property to Horizontal. Set the RadChart DefaultType property or ChartSeries.Type to Gantt.
Other Gantt chart issues:
-
To add dates to an axis or chart item, values must be converted to OleAutomation types.Use the DateTime.ToOADate() function for this purpose.
-
When setting a range for an axis that involves dates, set the axis IsZeroBased property to zero.This avoids having the range calculated from the minimum date value forward, instead of a range you define.
-
Use the ValueFormat property to display values as dates.
RadChart1.PlotArea.YAxis.Appearance.ValueFormat = Telerik.Charting.Styles.ChartValueFormat.ShortDate;