Data Binding RadChart to a Database Object
RadChart has been deprecated since Q3 2014 and is marked as obsolete as of the 2026 Q2 SP1 (v2026.2.708) release. This is the last release that includes the RadChart component — its source code will be removed from the assembly in the next release. We strongly recommend using RadHtmlChart, Telerik's modern client-side charting component. To transition from RadChart to RadHtmlChart, refer to the following migration articles:
Explore the RadHtmlChart documentation and online demos to determine how it fits your development needs.
To bind to a database, create a data source object, assign the data source to the RadChart and call the RadChart DataBind() method.
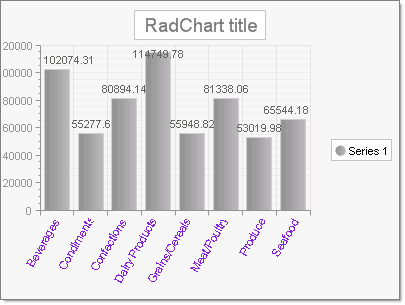
The figure above shows a running example that starts with a default RadChart with a single Series. The example code:
-
Creates a SqlDataSource, adds it to the page, assigns the RadChart DataSourceID property and finally binds to the data source.
-
Displays data for a database column by assigning the series DataYColumn or DataXColumn properties. In the example the "TotalSales" column is assigned to the DataYColumn property.
-
Displays database column data in the X axis labels by assigning the column name to the DataLabelsColumn. The example assigns "CategoryName" to the DataLabelsColumn property.
Also note how the example sets the PlotArea.Appearance.Dimensions.Margins.Bottom to 30% and the PlotArea.XAxis.Appearance.LabelAppearance.RotationAngle to 300 in order to provide room for the axis labels.
using System;
using System.Configuration;
using System.Web.UI.WebControls;
// Supports RadChart declaration
using Telerik.Web.UI;
// Supports RadChart objects, i.e. series, items
using Telerik.Charting;
namespace DatabindingExample
{
   public partial class _Default : System.Web.UI.Page
   {
	   protected void Page_Load(object sender, EventArgs e)
	   {
		   // create a datasource, add it to the page,
		   // and assign the datasource to RadChart
		   SqlDataSource sqlDataSource = new SqlDataSource();
		   sqlDataSource.ID = "myDataSource";
		   sqlDataSource.ConnectionString =
		   ConfigurationManager.ConnectionStrings["NorthwindConnectionString"].ConnectionString;
		   sqlDataSource.SelectCommand =
		   "SELECT CategoryName, SUM(ProductSales) AS TotalSales FROM [Product Sales for 1997] GROUP BY CategoryName";
		   this.Page.Controls.Add(sqlDataSource);
		   RadChart1.DataSourceID = "myDataSource";
		   // Set the column for data and data labels:
		   // Each bar will show "TotalSales", each label along
		   // X-axis will show "CategoryName.
		   RadChart1.Series[0].DataYColumn = "TotalSales";
		   RadChart1.PlotArea.XAxis.DataLabelsColumn = "CategoryName";
		   // assign appearance related properties
		   RadChart1.PlotArea.XAxis.Appearance.LabelAppearance.RotationAngle = 300;
		   RadChart1.PlotArea.XAxis.Appearance.TextAppearance.TextProperties.Color =
		   System.Drawing.Color.BlueViolet;
		   RadChart1.PlotArea.Appearance.Dimensions.Margins.Bottom =
		   Telerik.Charting.Styles.Unit.Percentage(30);
		   // bind to the datasource
		   RadChart1.DataBind();
	   }
   }
}