Series-Specific Properties
RadChart has been deprecated since Q3 2014 and is marked as obsolete as of the 2026 Q2 SP1 (v2026.2.708) release. This is the last release that includes the RadChart component — its source code will be removed from the assembly in the next release. We strongly recommend using RadHtmlChart, Telerik's modern client-side charting component. To transition from RadChart to RadHtmlChart, refer to the following migration articles:
Explore the RadHtmlChart documentation and online demos to determine how it fits your development needs.
The following are properties specific to the series appearance of specific chart types.
Bubble
The BubbleSize property is specific to the Bubble chart type and allows you to increase or decrease bubble size without distorting the shape.
Lines and Splines
The LineSeriesAppearance property is specific to the Line and Spline chart types.LineSeriesAppearance has a Cap property that governs the appearance of a line terminating shape that occurs where at each data point (except the first).Valid Cap values are Flat, Square, Round, Triangle, NoAnchor, SquareAnchor, RoundAnchor, DiamondAnchor, ArrowAnchor, AnchorMask and Custom. LineSeriesAppearance also has sub properties for Color, PenStyle, Visible and Width.
The PointMark is a shape that occurs at every data point, including the first.PointMarks are off by default but can be enabled using the Pointmark.Visible property. Use the Pointmark.Figure property to choose one of the predefined shapes. Other PointMark properties include Border, Corners, Dimensions, FillStyle, RotationAngle and Shadow.
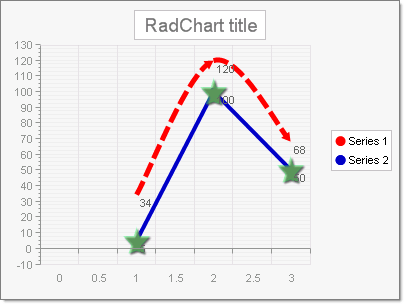
The example above shows Series 1 in red where LineSeriesAppearance properties are:
-
Cap = ArrowAnchor
-
Color = Red
-
PenStyle = Dash
-
Width = 5
Series 2 show in blue has PointMark properties set as:
-
Border.Color = 50, 0, 245, 100
-
Border.Width = 1
-
Figure = Star5
-
Visible = True
-
Dimensions.Height = 25px
-
Dimensions.Width = 25px
-
FillStyle.FillType = Solid
-
FillStyle.MainColor = 90, 100, 254, 100
-
Shadow.Blur = 1
-
Shadow.Color = DimGray
-
Shadow.Distance = 2
Pie
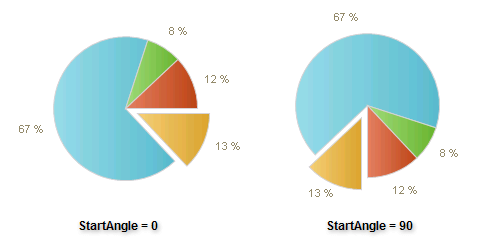
The StartAngle property specifies degrees for the rotation of a pie. The default value and the starting position is 0°. Positive values of the StartAngle property will rotate the pie clockwise and negative - counterclockwise.
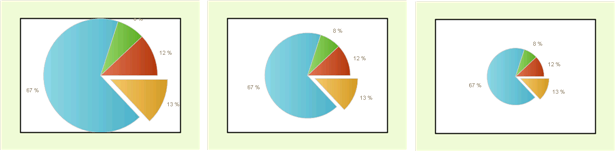
The DiameterScale property controls the ratio between the size of the plot area and the diameter of the chart. It effectively sets the size of the pie. In the example below, DiameterScale is set to 1, .75 (the default) and .5.
When true, the ShowLabelConnectors property visually ties the label with the corresponding pie slice.
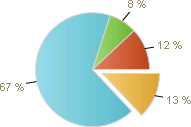
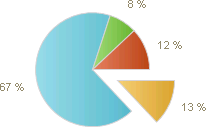
The ExplodePercent property defines the percentage of explosion of pie pieces. By default this is 20 percent.In the example below it is set to 50 percent:
The CenterXOffset and CenterYOffset properties specify the distance from the center of the plot area to the center of the pie in pixels. Use these two properties to position pie charts within the plot area.