New to Telerik UI for .NET MAUI? Start a free 30-day trial
.NET MAUI CartesianChart Overview
Updated on Oct 7, 2026
The Telerik UI for .NET MAUI Cartesian Chart (RadCartesianChart) visualizes data in a Cartesian coordinate system. The horizontal and vertical axes define how the coordinates of each data point in the plot area are calculated, and the series type defines how these data points are rendered.
Series
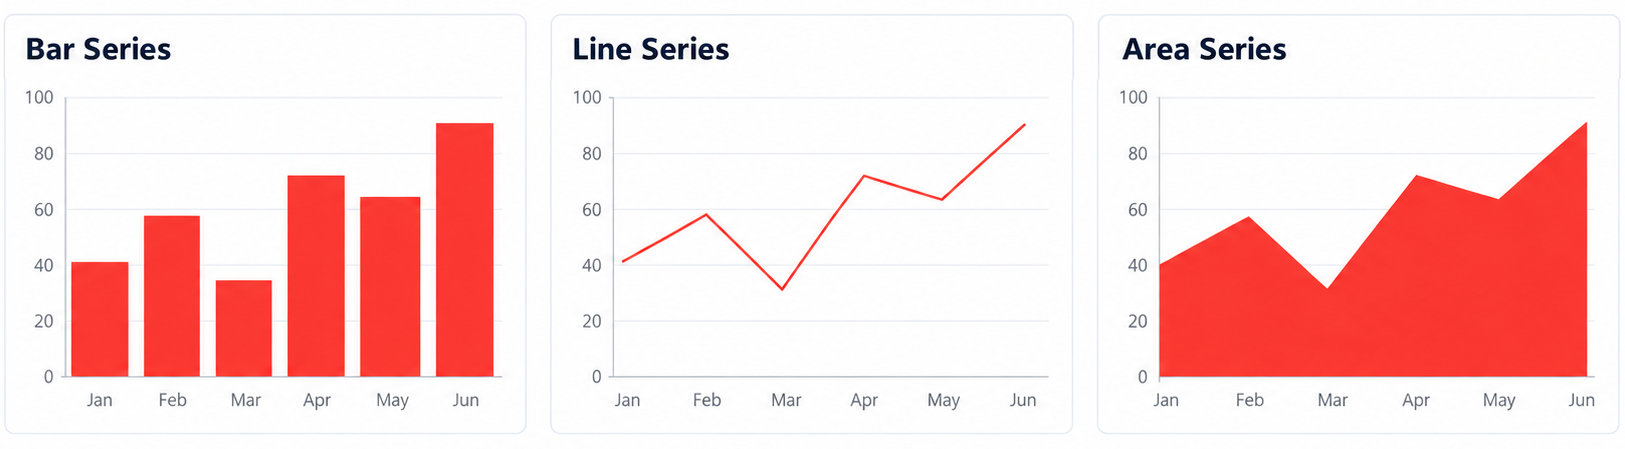
The Cartesian Chart plots data through the following series:
| Series | Description |
|---|---|
BarSeries | Represents each data point as a bar. |
LineSeries | Connects the data points with straight line segments. |
AreaSeries | Fills the area between the line that connects the data points and the axis. |
PointSeries | Represents each data point as a symbol positioned by two numerical values. |
SplineSeries | Connects the data points with a smooth curve. |
SplineAreaSeries | Fills the area between the smooth curve that connects the data points and the axis. |
Axes
You can use the following axes to position the data points in a CartesianChart.
| Axis | Description |
|---|---|
| Categorical Axis | Arranges the data points in discrete categories—for example, product names or months. |
| Numerical Axis | Positions the data points depending on their numeric value over a continuous range. |
| Date-Time Axis | Positions the data points on a time line based on their System.DateTime value. |
Key Features
- Grid Lines—Display horizontal and vertical grid lines.
- Data Point Labels—Show labels for the data points of a series.
- Multiple Series—Combine several series in a single chart.
- Palette—Control the colors applied to the series.
- Plot Areas—Split the chart into separate plot areas.
- Stacked Bar Series—Stack the bars of a
BarSerieson top of each other by using theCombineModeproperty. - Null Values—Handle null values in the series.
Next Steps
- Visual Structure of the .NET MAUI Cartesian Chart
- Getting Started with the .NET MAUI Cartesian Chart