Getting Started with the .NET MAUI CartesianChart
This guide provides the information you need to start using the Telerik UI for .NET MAUI CartesianChart by adding the control to your project.
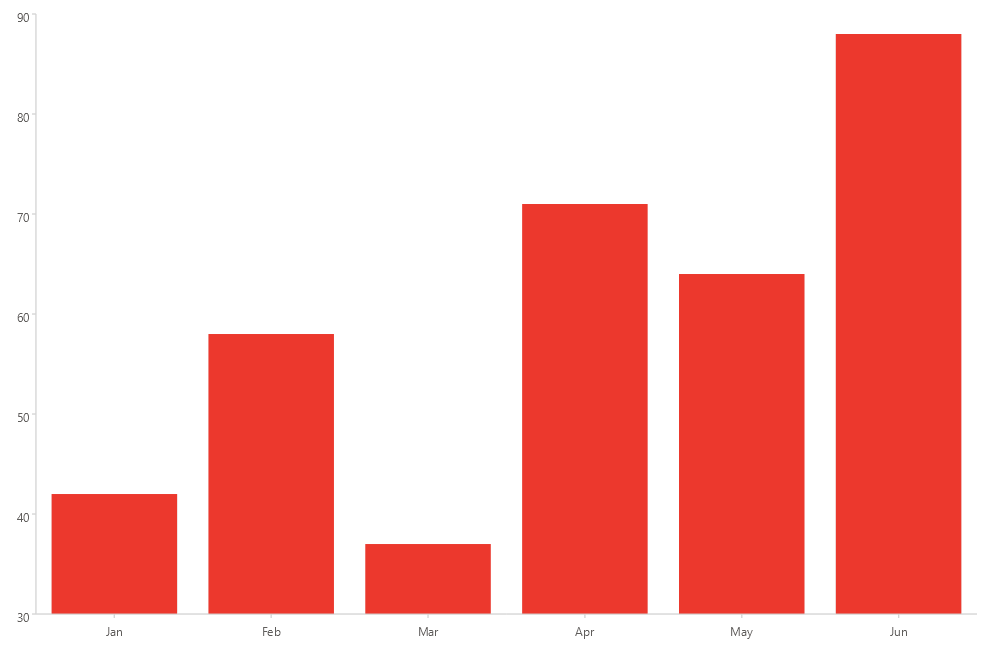
At the end, you will be able to achieve the following result.
Prerequisites
Before adding the CartesianChart, you need to:
Define the Control
-
When your .NET MAUI application is set up, you are ready to add a
RadCartesianChartto your page. The following example defines a chart with aCategoricalAxis, aNumericalAxis, and aBarSeries:XAML<charts:RadCartesianChart> <charts:RadCartesianChart.BindingContext> <models:CategoricalViewModel /> </charts:RadCartesianChart.BindingContext> <charts:RadCartesianChart.Axes> <charts:CategoricalAxis /> <charts:NumericalAxis /> </charts:RadCartesianChart.Axes> <charts:RadCartesianChart.Series> <charts:BarSeries HorizontalBinding="Category" VerticalBinding="Value" ItemsSource="{Binding Data}" /> </charts:RadCartesianChart.Series> </charts:RadCartesianChart> -
Add the
chartnamespace:XAMLxmlns:charts="clr-namespace:Telerik.Maui.Controls.Charts;assembly=Telerik.Maui.Controls" -
Register the Telerik controls through the
Telerik.Maui.Controls.Compatibility.UseTelerikextension method called inside theCreateMauiAppmethod of theMauiProgram.csfile of your project:C#using Telerik.Maui.Controls.Compatibility; public static class MauiProgram { public static MauiApp CreateMauiApp() { var builder = MauiApp.CreateBuilder(); builder .UseTelerik() .UseMauiApp<App>() .ConfigureFonts(fonts => { fonts.AddFont("OpenSans-Regular.ttf", "OpenSansRegular"); }); return builder.Build(); } }
The BarSeries binds to a collection of items through its ItemsSource property, while the HorizontalBinding and VerticalBinding properties define which data-item members supply the category and the value of each data point.
For a runnable example with the CartesianChart Getting Started scenario, go to the SDKBrowser Demo Application and navigate to the Charts > Getting Started category.
Additional Resources
- .NET MAUI CartesianChart Categorical Axis
- .NET MAUI CartesianChart Numerical Axis
- .NET MAUI CartesianChart Date-Time Axis
- .NET MAUI Charts Product Page
- .NET MAUI Charts Forum Page