.NET MAUI Charts Overview
Updated on Oct 7, 2026
The Telerik UI for .NET MAUI Charts provide a data-visualization solution built from two complementary chart controls. Each control targets a different plotting model and exposes its own series types, axes, and features, so that you can represent your data in the most suitable way.
 Start Free Trial
Charts
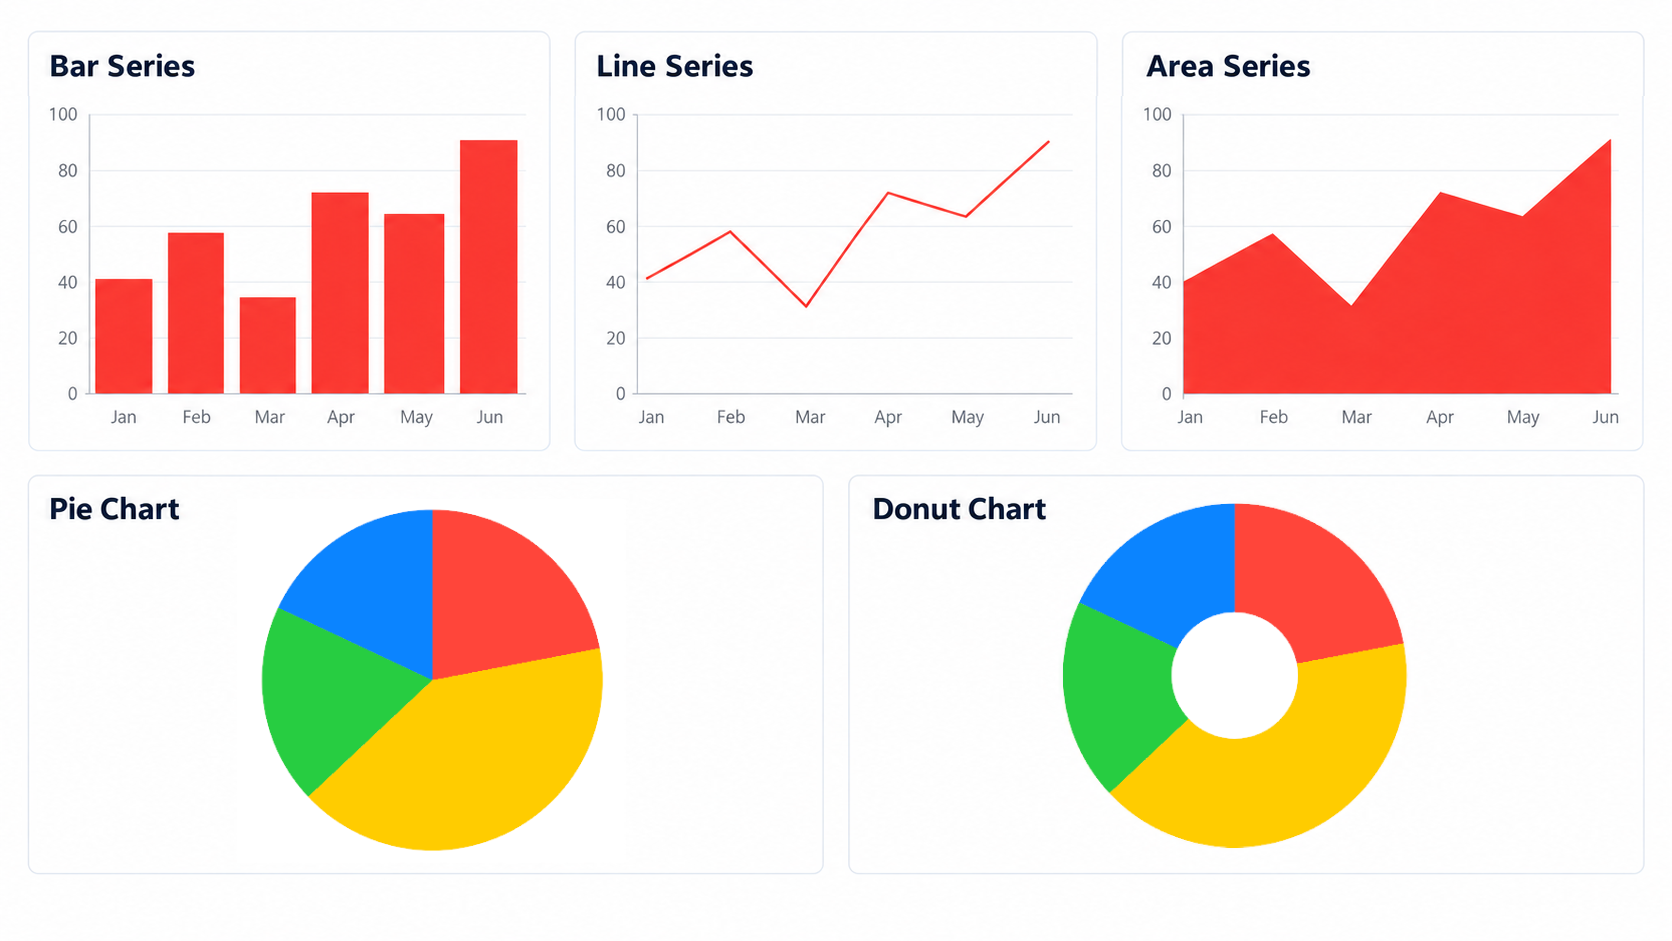
The Charts consist of the following controls:
- CartesianChart—Plots data in a Cartesian coordinate system defined by horizontal and vertical axes. It renders
BarSeries,LineSeries,AreaSeries,PointSeries,SplineSeries,SplineAreaSeries, and supports categorical, numerical, and date-time axes. - PieChart—Plots data as proportional slices of a circle. It renders
PieSeriesandDonutSeriesand does not use axes.