New to Telerik UI for .NET MAUI? Start a free 30-day trial
.NET MAUI PieChart Overview
Updated on Aug 20, 2026
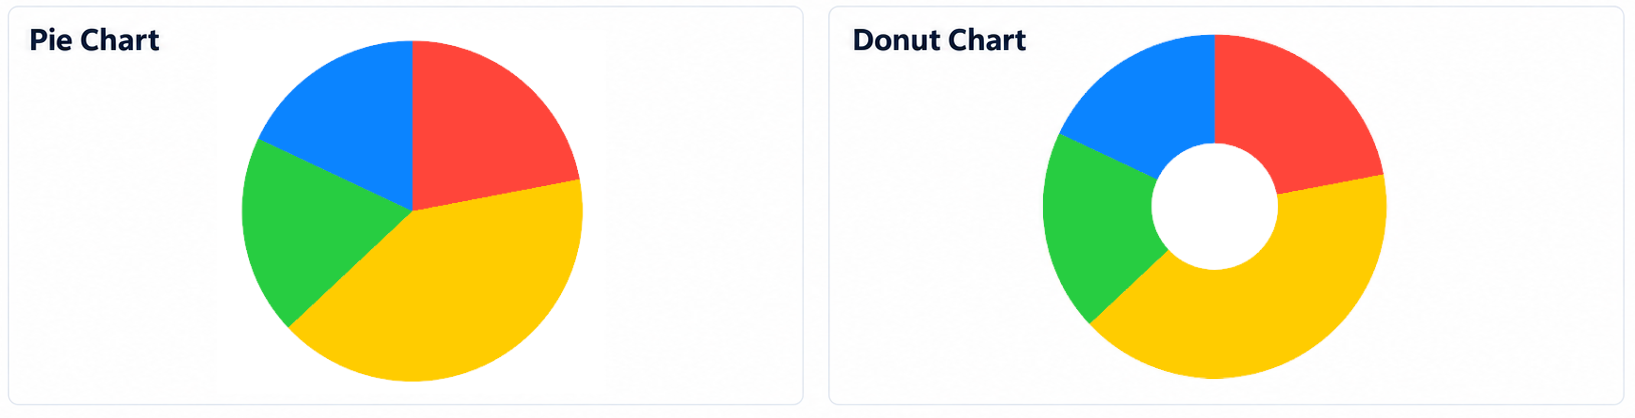
The Telerik UI for .NET MAUI PieChart (RadPieChart) displays data as a sliced circle, where each slice represents a single data point and its size reflects that point's value as a percentage of the total sum.
Series
The PieChart plots data through the following series:
PieSeries—Represents the data points as slices of a full circle.DonutSeries—Represents the data points as slices of a ring with a hollow center.