New to Telerik UI for .NET MAUI? Start a free 30-day trial
.NET MAUI PieChart - Pie Series
Updated on Aug 20, 2026
The Telerik UI for .NET MAUI PieChart exposes a pie series. The pie series is used to visualize data in a circular graph, where each slice represents a proportion of the whole.
Data Binding
The pie series binds to data through the following properties:
ItemsSource(IEnumerable)—Defines the collection of data items that the series plots.ValueBinding(string)—Defines the name of the data-item member that provides the value of each slice.LabelBinding(string)—Defines the name of the data-item member that provides the label of each slice.IsVisible(bool)—Defines a value indicating whether the series is visible.
Labels Settings
Use the following properties to customize the appearance of the labels in the pie series:
LabelOffsetFraction(double)—Defines the position of the labels relative to the radius of the series.ShowLabels(bool)—Defines a value indicating whether the labels are visible.LabelStyle(ChartDataPointLabelStyle)—Defines the style of the labels.
Pie Settings
Use the following properties to customize the appearance of the pie series:
Stroke(Brush)—Defines the brush of the stroke of the slices.StrokeThickness(double)—Defines the thickness of the stroke of the slices.
Example
- Define the pie series in XAML:
XAML
<charts:RadPieChart>
    <charts:RadPieChart.BindingContext>
        <models:PieViewModel />
    </charts:RadPieChart.BindingContext>
    <charts:RadPieChart.Series>
        <charts:PieSeries ValueBinding="Value"
                          LabelBinding="Label"
                          LabelOffsetFraction="0.85"
                          ItemsSource="{Binding Data}" />
    </charts:RadPieChart.Series>
</charts:RadPieChart>- Add the
chartsnamespace:
XAML
xmlns:charts="clr-namespace:Telerik.Maui.Controls.Charts;assembly=Telerik.Maui.Controls"- Define the data model:
C#
public class PieData
{
    public string Label { get; set; }

    public double Value { get; set; }
}- Define the
ViewModel:
C#
public class PieViewModel
{
    public ObservableCollection<PieData> Data { get; } = new ObservableCollection<PieData>
    {
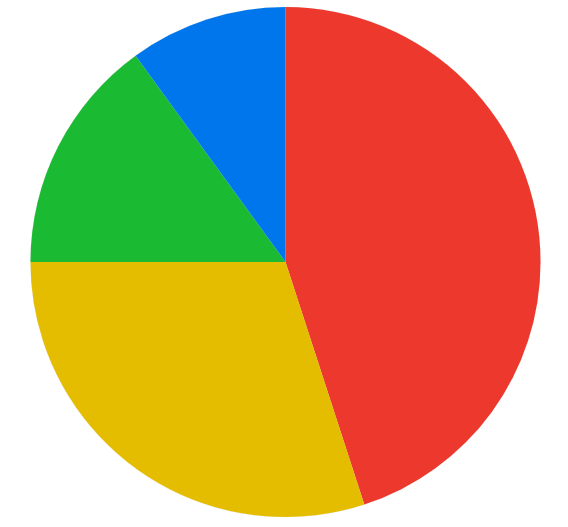
        new PieData { Label = "Mobile", Value = 45 },
        new PieData { Label = "Desktop", Value = 30 },
        new PieData { Label = "Tablet", Value = 15 },
        new PieData { Label = "Other", Value = 10 },
    };
}
This is the result:
For runnable examples with the PieChart pie series, go to the SDKBrowser Demo Application and navigate to the Charts > Series category.