New to Telerik UI for .NET MAUI? Start a free 30-day trial
.NET MAUI Cartesian Chart Grid Lines
Updated on Aug 20, 2026
The Telerik UI for .NET MAUI Cartesian Chart can decorate its plot area with grid lines that improve the readability of the plotted data. You configure the grid lines through the Grid property of the RadCartesianChart, which accepts a CartesianChartGrid instance.
Configuration
To configure the grid lines, use the following properties of the CartesianChartGrid:
MajorLinesVisibility(Telerik.Maui.Controls.Charts.ChartGridLinesVisibility)—Defines which major grid lines are visible. The available values areNone,Horizontal,Vertical, andBoth. The default value isBoth.MajorLineThickness(double)—Defines the thickness of the major grid lines. The default value is1.MajorLineColor(Color)—Defines the color of the major grid lines.
Example
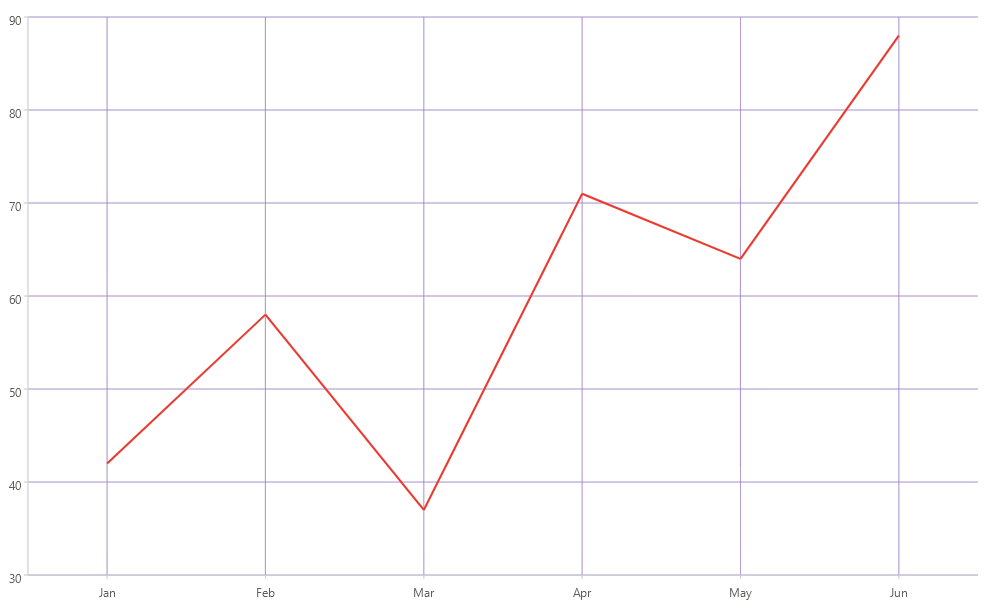
The following example demonstrates how to display both horizontal and vertical grid lines.
- Add the
RadCartesianChartto your XAML page and configure the grid lines:
XAML
<charts:RadCartesianChart Grid.Row="1">
    <charts:RadCartesianChart.BindingContext>
        <models:CategoricalViewModel />
    </charts:RadCartesianChart.BindingContext>
    <charts:RadCartesianChart.Grid>
        <charts:CartesianChartGrid MajorLinesVisibility="Both"
                                   x:Name="gridLines"
                                   MajorLineColor="#99865FC5"
                                   MajorLineThickness="1" />
    </charts:RadCartesianChart.Grid>
    <charts:RadCartesianChart.Axes>
        <charts:CategoricalAxis />
        <charts:NumericalAxis Location="Left" />
    </charts:RadCartesianChart.Axes>
    <charts:RadCartesianChart.Series>
        <charts:LineSeries HorizontalBinding="Category"
                           VerticalBinding="Value"
                           ItemsSource="{Binding Data}" />
    </charts:RadCartesianChart.Series>
</charts:RadCartesianChart>- Add the
chartsnamespace:
XAML
xmlns:charts="clr-namespace:Telerik.Maui.Controls.Charts;assembly=Telerik.Maui.Controls"- Define the data model:
C#
public class CategoricalData
{
    public string Category { get; set; }

    public double Value { get; set; }
}- Define the
ViewModel:
C#
public class CategoricalViewModel
{
    public ObservableCollection<CategoricalData> Data { get; } = new ObservableCollection<CategoricalData>
    {
        new CategoricalData { Category = "Jan", Value = 42 },
        new CategoricalData { Category = "Feb", Value = 58 },
        new CategoricalData { Category = "Mar", Value = 37 },
        new CategoricalData { Category = "Apr", Value = 71 },
        new CategoricalData { Category = "May", Value = 64 },
        new CategoricalData { Category = "Jun", Value = 88 },
    };
}
This is the result:
For a runnable example with the CartesianChart Grid Lines scenario, go to the SDKBrowser Demo Application and navigate to the Charts > Features category.