New to Telerik UI for .NET MAUI? Start a free 30-day trial
.NET MAUI CartesianChart Data Point Labels
Updated on Sep 14, 2026
The Telerik UI for .NET MAUI CartesianChart can display labels for the individual data points of a series. The labels annotate each data point with its value directly in the plot area.
Configuration
To configure the data point labels, use the following properties of the series:
ShowLabels(bool)&mdashDefines whether the series displays labels for its data points.LabelStyle(Stylewith target typeChartLabelAppearance)—Defines the style of the series labels.LabelOffset(Microsoft.Maui.Graphics.Point)—Defines the offset that is applied to the position of each label.
The ChartLabelAppearance style exposes appearance properties such as TextColor, FontSize, FontFamily and FontAttributes.
Example
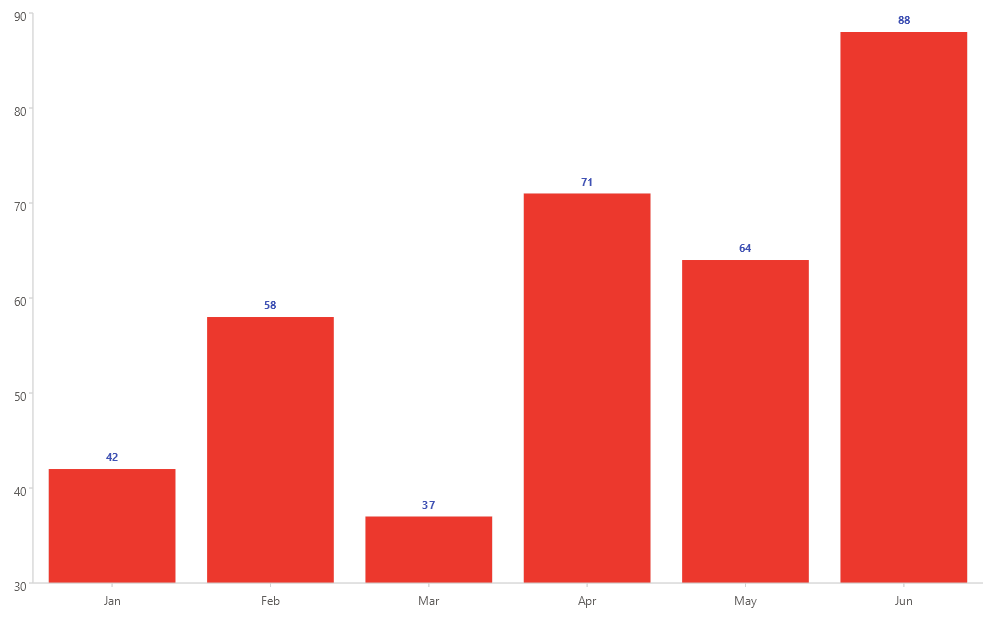
The following example demonstrates how to display customized labels for a BarSeries.
- Define the
BarSeriesin XAML and set theShowLabelsproperty toTrue. Then, define a style for the labels and set it to theLabelStyleproperty of the series.
XAML
        <charts:RadCartesianChart Grid.Row="1">
<charts:RadCartesianChart.BindingContext>
    <models:CategoricalViewModel />
</charts:RadCartesianChart.BindingContext>
<charts:RadCartesianChart.Resources>
    <Style x:Key="dataPointLabelStyle" TargetType="charts:ChartLabelAppearance">
        <Setter Property="TextColor" Value="#3F51B5" />
        <Setter Property="FontSize" Value="11" />
        <Setter Property="FontAttributes" Value="Bold" />
    </Style>
</charts:RadCartesianChart.Resources>
<charts:RadCartesianChart.Axes>
    <charts:CategoricalAxis />
    <charts:NumericalAxis />
</charts:RadCartesianChart.Axes>
<charts:RadCartesianChart.Series>
    <charts:BarSeries HorizontalBinding="Category"
                      VerticalBinding="Value"
                      x:Name="barSeries"
                      ItemsSource="{Binding Data}"
                      ShowLabels="True"
                      LabelStyle="{StaticResource dataPointLabelStyle}"
                      LabelOffset="0, 8" />
</charts:RadCartesianChart.Series>
</charts:RadCartesianChart>- Add the
chartsnamespace:
XAML
xmlns:charts="clr-namespace:Telerik.Maui.Controls.Charts;assembly=Telerik.Maui.Controls"- Define the data model:
C#
public class CategoricalData
{
    public string Category { get; set; }

    public double Value { get; set; }
}- Define the
ViewModel:
C#
public class CategoricalViewModel
{
    public ObservableCollection<CategoricalData> Data { get; } = new ObservableCollection<CategoricalData>
    {
        new CategoricalData { Category = "Jan", Value = 42 },
        new CategoricalData { Category = "Feb", Value = 58 },
        new CategoricalData { Category = "Mar", Value = 37 },
        new CategoricalData { Category = "Apr", Value = 71 },
        new CategoricalData { Category = "May", Value = 64 },
        new CategoricalData { Category = "Jun", Value = 88 },
    };
}
This is the result:
For a runnable example with the Cartesian Chart Data Point Labels scenario, go to the SDKBrowser Demo Application and navigate to the Charts > Features category.