.NET MAUI Cartesian Chart Multiple Series
The Telerik UI for .NET MAUI CartesianChart can render several series in a single chart instance. Add each series to the Series collection of the RadCartesianChart, and use the DisplayName property to identify each series.
Configuration
When you combine series, keep the following in mind:
- Each series is added to the
Seriescollection of the chart. - The series share the axes defined in the
Axescollection, unless a series specifies its ownHorizontalAxisandVerticalAxis. - Use the
DisplayName(string) property of each series to distinguish it, for example in a legend.
Example
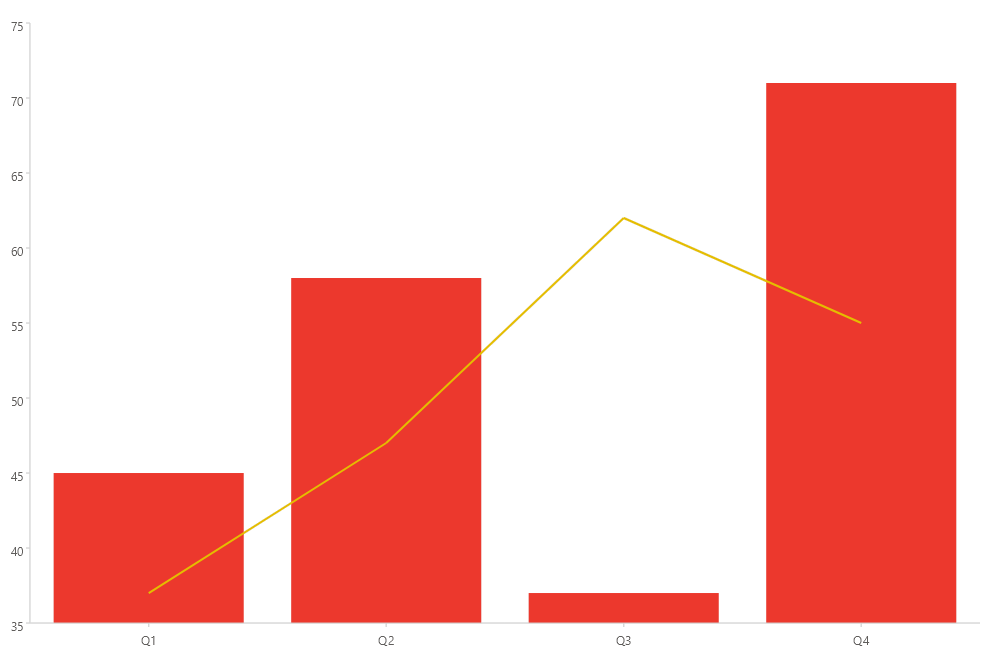
The following example demonstrates how to combine a BarSeries and a LineSeries in a single chart.
<charts:RadCartesianChart>
    <charts:RadCartesianChart.BindingContext>
        <models:MultiSeriesViewModel />
    </charts:RadCartesianChart.BindingContext>
    <charts:RadCartesianChart.Axes>
        <charts:CategoricalAxis />
        <charts:NumericalAxis />
    </charts:RadCartesianChart.Axes>
    <charts:RadCartesianChart.Series>
        <charts:BarSeries DisplayName="Product A"
                          HorizontalBinding="Category"
                          VerticalBinding="ProductA"
                          ItemsSource="{Binding Data}" />
        <charts:LineSeries DisplayName="Product B"
                           HorizontalBinding="Category"
                           VerticalBinding="ProductB"
                           ItemsSource="{Binding Data}"
                           StrokeThickness="2" />
    </charts:RadCartesianChart.Series>
</charts:RadCartesianChart>- Add the
chartsnamespace:
xmlns:charts="clr-namespace:Telerik.Maui.Controls.Charts;assembly=Telerik.Maui.Controls"- Define the data model:
public class MultiSeriesData
{
    public string Category { get; set; }

    public double ProductA { get; set; }

    public double ProductB { get; set; }
}- Define the
ViewModel:
public class MultiSeriesViewModel
{
    public ObservableCollection<MultiSeriesData> Data { get; } = new ObservableCollection<MultiSeriesData>
    {
        new MultiSeriesData { Category = "Q1", ProductA = 45, ProductB = 37 },
        new MultiSeriesData { Category = "Q2", ProductA = 58, ProductB = 47 },
        new MultiSeriesData { Category = "Q3", ProductA = 37, ProductB = 62 },
        new MultiSeriesData { Category = "Q4", ProductA = 71, ProductB = 55 },
    };
}
This is the result:
For a runnable example with the CartesianChart Multiple Series scenario, go to the SDKBrowser Demo Application and navigate to the Charts > Features category.
Explicit Axes
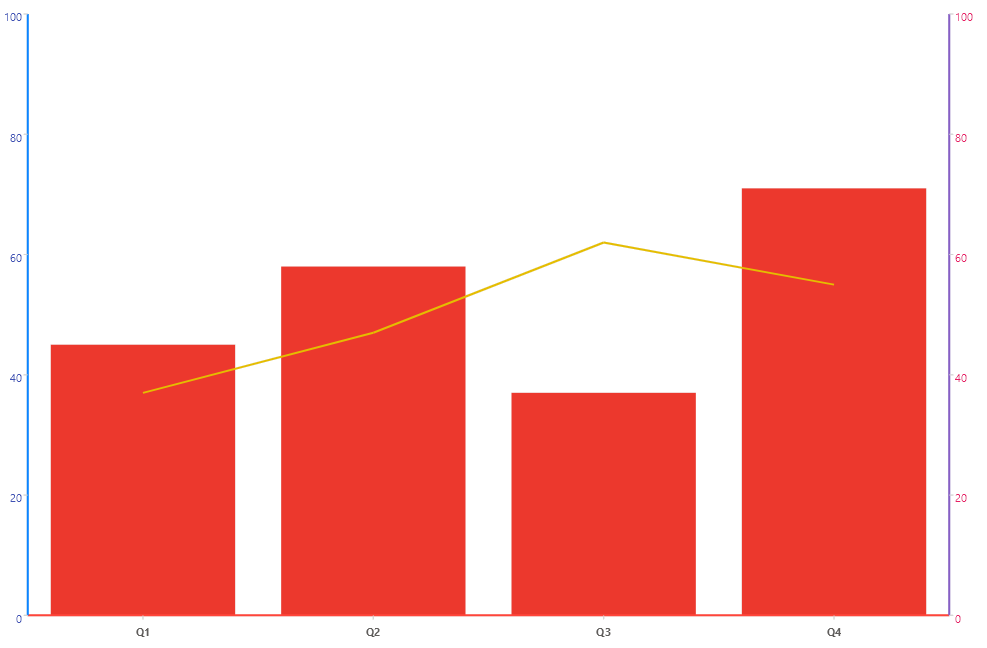
When a chart renders multiple series, you can associate each series with a specific axis through the HorizontalAxis and VerticalAxis properties of the series. This lets you plot series against different value axes in the same chart.
Here is an example of a chart with two series, each associated with its own axis:
- Add the
RadCartesianChartto your XAML page and configure the series with explicit axes:
<charts:RadCartesianChart>
    <charts:RadCartesianChart.BindingContext>
        <models:MultiSeriesViewModel />
    </charts:RadCartesianChart.BindingContext>
    <charts:RadCartesianChart.Resources>
        <Style x:Key="categoryLabelStyle" TargetType="charts:ChartLabelAppearance">
            <Setter Property="FontSize" Value="11" />
            <Setter Property="FontAttributes" Value="Bold" />
        </Style>
        <Style x:Key="primaryLabelStyle" TargetType="charts:ChartLabelAppearance">
            <Setter Property="TextColor" Value="#3F51B5" />
            <Setter Property="FontSize" Value="11" />
        </Style>
        <Style x:Key="secondaryLabelStyle" TargetType="charts:ChartLabelAppearance">
            <Setter Property="TextColor" Value="#E91E63" />
            <Setter Property="FontSize" Value="11" />
        </Style>
    </charts:RadCartesianChart.Resources>
    <charts:RadCartesianChart.Axes>
        <charts:CategoricalAxis x:Name="categoryAxis"
                                Location="Bottom"
                                LabelStyle="{StaticResource categoryLabelStyle}"
                                ShowLabels="True"
                                LineColor="#FF453A"
                                LineThickness="2" />
        <charts:NumericalAxis x:Name="primaryValueAxis"
                              Location="Left"
                              Minimum="0"
                              Maximum="100"
                              LabelStyle="{StaticResource primaryLabelStyle}"
                              ShowLabels="True"
                              LineColor="#0B84FF"
                              LineThickness="2" />
        <charts:NumericalAxis x:Name="secondaryValueAxis"
                              Location="Right"
                              Minimum="0"
                              Maximum="100"
                              LabelStyle="{StaticResource secondaryLabelStyle}"
                              ShowLabels="True"
                              LineColor="#865FC5"
                              LineThickness="2" />
    </charts:RadCartesianChart.Axes>
    <charts:RadCartesianChart.Series>
        <charts:BarSeries DisplayName="Product A"
                          HorizontalBinding="Category"
                          VerticalBinding="ProductA"
                          ItemsSource="{Binding Data}"
                          HorizontalAxis="{x:Reference categoryAxis}"
                          VerticalAxis="{x:Reference primaryValueAxis}" />
        <charts:LineSeries DisplayName="Product B"
                           HorizontalBinding="Category"
                           VerticalBinding="ProductB"
                           ItemsSource="{Binding Data}"
                           StrokeThickness="2"
                           HorizontalAxis="{x:Reference categoryAxis}"
                           VerticalAxis="{x:Reference secondaryValueAxis}" />
    </charts:RadCartesianChart.Series>
</charts:RadCartesianChart>- Add the
chartsnamespace:
xmlns:charts="clr-namespace:Telerik.Maui.Controls.Charts;assembly=Telerik.Maui.Controls"- Define the data model:
public class MultiSeriesData
{
    public string Category { get; set; }

    public double ProductA { get; set; }

    public double ProductB { get; set; }
}- Define the
ViewModel:
public class MultiSeriesViewModel
{
    public ObservableCollection<MultiSeriesData> Data { get; } = new ObservableCollection<MultiSeriesData>
    {
        new MultiSeriesData { Category = "Q1", ProductA = 45, ProductB = 37 },
        new MultiSeriesData { Category = "Q2", ProductA = 58, ProductB = 47 },
        new MultiSeriesData { Category = "Q3", ProductA = 37, ProductB = 62 },
        new MultiSeriesData { Category = "Q4", ProductA = 71, ProductB = 55 },
    };
}
This is the result: