New to Telerik UI for .NET MAUI? Start a free 30-day trial
.NET MAUI Cartesian Chart Plot Areas
Updated on Aug 20, 2026
The Telerik UI for .NET MAUI CartesianChart can split its rendering surface into separate plot areas. Each plot area hosts its own series and axes, which lets you stack multiple panes that share a common axis.
Configuration
To define plot areas, use the following members:
PlotAreas—The collection ofChartPlotAreainstances defined on theRadCartesianChart.ChartPlotArea—Represents a single plot area. Assign it to thePlotAreaproperty of an axis or a series to associate the element with the plot area.PlotArea(ChartPlotArea)—The property exposed by the axes and the series that associates the element with a specific plot area.
Associate each axis and series with a plot area through the
PlotAreaproperty, and share an axis across plot areas by referencing the same axis instance.
Example
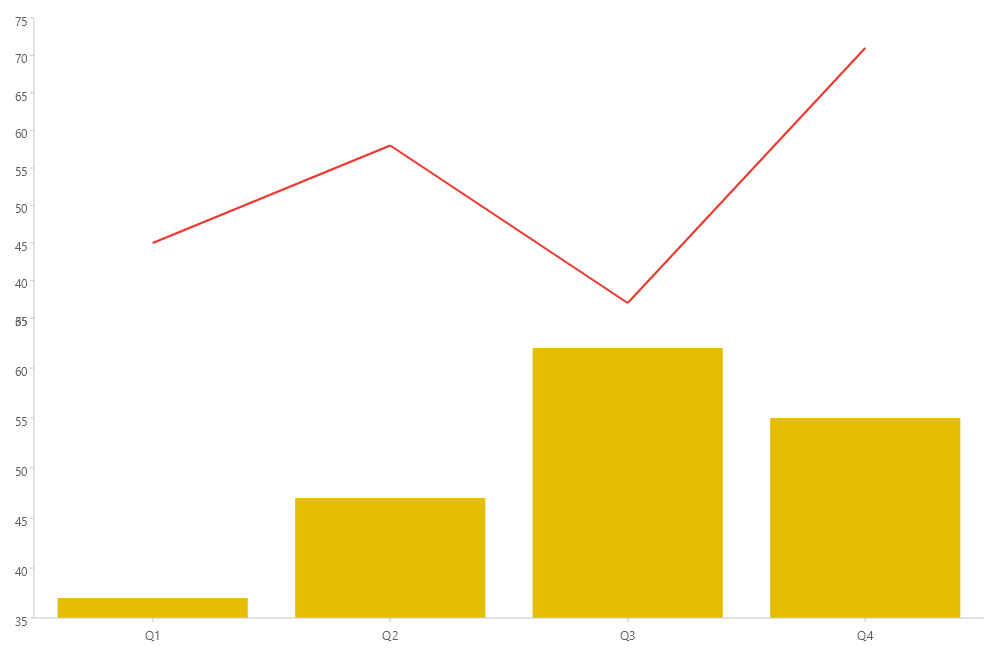
The following example demonstrates how to split the chart into two plot areas that share a common categorical axis.
- Define two
ChartPlotAreainstances in thePlotAreascollection of theRadCartesianChart.
XAML
<charts:RadCartesianChart>
    <charts:RadCartesianChart.BindingContext>
        <models:MultiSeriesViewModel />
    </charts:RadCartesianChart.BindingContext>
    <charts:RadCartesianChart.PlotAreas>
        <charts:ChartPlotArea x:Name="topPlotArea" />
        <charts:ChartPlotArea x:Name="bottomPlotArea" />
    </charts:RadCartesianChart.PlotAreas>
    <charts:RadCartesianChart.Axes>
        <charts:CategoricalAxis x:Name="sharedCategoryAxis"
                                Location="Bottom"
                                PlotArea="{x:Reference bottomPlotArea}" />
        <charts:NumericalAxis x:Name="topValueAxis"
                              Location="Left"
                              PlotArea="{x:Reference topPlotArea}" />
        <charts:NumericalAxis x:Name="bottomValueAxis"
                              Location="Left"
                              PlotArea="{x:Reference bottomPlotArea}" />
    </charts:RadCartesianChart.Axes>
    <charts:RadCartesianChart.Series>
        <charts:LineSeries DisplayName="Product A"
                           HorizontalBinding="Category"
                           VerticalBinding="ProductA"
                           ItemsSource="{Binding Data}"
                           StrokeThickness="2"
                           PlotArea="{x:Reference topPlotArea}"
                           HorizontalAxis="{x:Reference sharedCategoryAxis}"
                           VerticalAxis="{x:Reference topValueAxis}" />
        <charts:BarSeries DisplayName="Product B"
                          HorizontalBinding="Category"
                          VerticalBinding="ProductB"
                          ItemsSource="{Binding Data}"
                          PlotArea="{x:Reference bottomPlotArea}"
                          HorizontalAxis="{x:Reference sharedCategoryAxis}"
                          VerticalAxis="{x:Reference bottomValueAxis}" />
    </charts:RadCartesianChart.Series>
</charts:RadCartesianChart>- Add the
chartsnamespace:
XAML
xmlns:charts="clr-namespace:Telerik.Maui.Controls.Charts;assembly=Telerik.Maui.Controls"- Define the data model:
C#
public class MultiSeriesData
{
    public string Category { get; set; }

    public double ProductA { get; set; }

    public double ProductB { get; set; }
}- Define the
ViewModel:
C#
public class MultiSeriesViewModel
{
    public ObservableCollection<MultiSeriesData> Data { get; } = new ObservableCollection<MultiSeriesData>
    {
        new MultiSeriesData { Category = "Q1", ProductA = 45, ProductB = 37 },
        new MultiSeriesData { Category = "Q2", ProductA = 58, ProductB = 47 },
        new MultiSeriesData { Category = "Q3", ProductA = 37, ProductB = 62 },
        new MultiSeriesData { Category = "Q4", ProductA = 71, ProductB = 55 },
    };
}
This is the result:
For a runnable example with the CartesianChart Plot Areas scenario, go to the SDKBrowser Demo Application and navigate to the Charts > Features category.