New to Telerik UI for .NET MAUI? Start a free 30-day trial
.NET MAUI Cartesian Chart Palette
Updated on Aug 20, 2026
The Telerik UI for .NET MAUI CartesianChart applies colors to its series through a palette. You define a custom palette through the Palette property of the RadCartesianChart, which accepts a ChartPalette instance.
Configuration
To define a custom palette, use the following types:
ChartPalette—Represents the palette that is applied to the chart. It exposes theEntriescollection.ChartPaletteEntry—Represents a single entry of the palette. Use the following properties to define the entry:FillColor(Color)—Defines the color that is applied to a series.StrokeColor(Color)—Defines the color that is applied to the series' stroke.
The palette entries apply to the series in the order in which the series are added to the chart.
Example
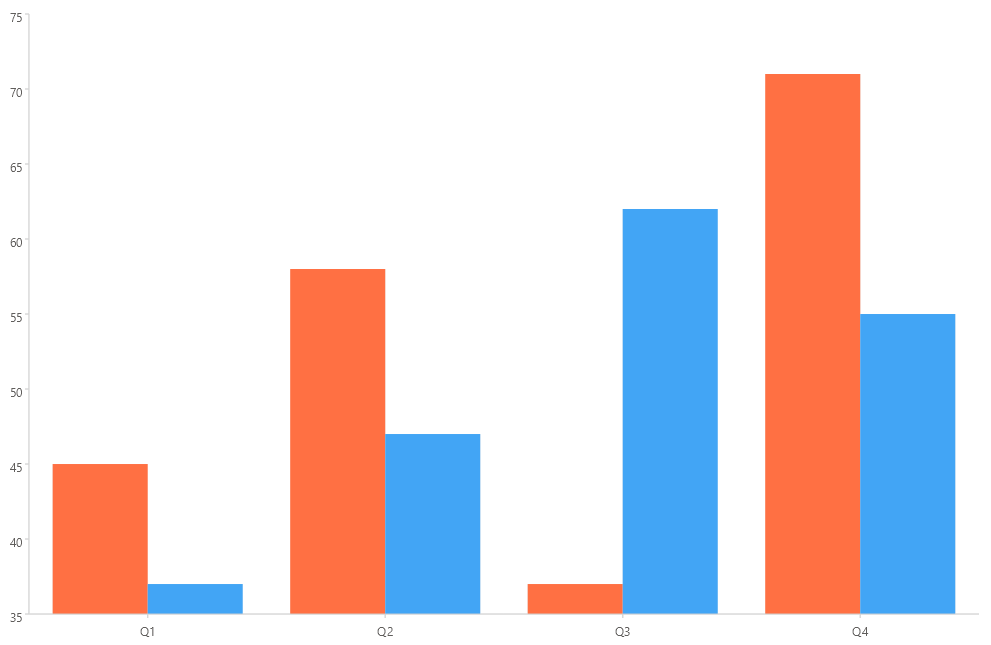
The following example demonstrates how to apply a custom palette to two bar series.
- Define the Chart with
BarSeriesand aChartPaletteinstance and add twoChartPaletteEntryinstances to it:
XAML
<charts:RadCartesianChart>
    <charts:RadCartesianChart.BindingContext>
        <models:MultiSeriesViewModel />
    </charts:RadCartesianChart.BindingContext>
    <charts:RadCartesianChart.Palette>
        <charts:ChartPalette>
            <charts:ChartPalette.Entries>
                <charts:ChartPaletteEntry FillColor="#FF7043" />
                <charts:ChartPaletteEntry FillColor="#42A5F5" />
            </charts:ChartPalette.Entries>
        </charts:ChartPalette>
    </charts:RadCartesianChart.Palette>
    <charts:RadCartesianChart.Axes>
        <charts:CategoricalAxis />
        <charts:NumericalAxis />
    </charts:RadCartesianChart.Axes>
    <charts:RadCartesianChart.Series>
        <charts:BarSeries HorizontalBinding="Category"
                          VerticalBinding="ProductA"
                          ItemsSource="{Binding Data}" />
        <charts:BarSeries HorizontalBinding="Category"
                          VerticalBinding="ProductB"
                          ItemsSource="{Binding Data}" />
    </charts:RadCartesianChart.Series>
</charts:RadCartesianChart>- Add the
chartsnamespace:
XAML
xmlns:charts="clr-namespace:Telerik.Maui.Controls.Charts;assembly=Telerik.Maui.Controls"- Define the data model:
C#
public class MultiSeriesData
{
    public string Category { get; set; }

    public double ProductA { get; set; }

    public double ProductB { get; set; }
}- Define the
ViewModel:
C#
public class MultiSeriesViewModel
{
    public ObservableCollection<MultiSeriesData> Data { get; } = new ObservableCollection<MultiSeriesData>
    {
        new MultiSeriesData { Category = "Q1", ProductA = 45, ProductB = 37 },
        new MultiSeriesData { Category = "Q2", ProductA = 58, ProductB = 47 },
        new MultiSeriesData { Category = "Q3", ProductA = 37, ProductB = 62 },
        new MultiSeriesData { Category = "Q4", ProductA = 71, ProductB = 55 },
    };
}
This is the result:
For a runnable example with the CartesianChart Palette scenario, go to the SDKBrowser Demo Application and navigate to the Charts > Features category.