.NET MAUI Cartesian Chart Point Series
The PointSeries represents each data point as a symbol positioned by two values.
Data Binding
The PointSeries binds to data through the following properties:
ItemsSource(IEnumerable)—Defines the collection of data items that the series plots.HorizontalBinding(string)—Defines the name of the data-item member that provides the value of each point and this value is plotted along the horizontal axis.VerticalBinding(string)—Defines the name of the data-item member that provides the value of each point and this value is plotted along the vertical axis.VerticalAxis(Telerik.Maui.Controls.Charts.ChartAxis)—Defines the vertical axis for the series which values resolved from theVerticalBindingproperty are plotted against.HorizontalAxis(Telerik.Maui.Controls.Charts.ChartAxis)—Defines the horizontal axis for the series which values resolved from theHorizontalBindingproperty are plotted against.
Point Customization
Use the following properties to customize the appearance of the points:
Fill(Brush)—Defines the fill of the points.PointSize(double)—Defines the size of the points.Stroke(Brush)—Defines the brush to paint the stroke of the points.StrokeThickness(double)—Defines the thickness of the points stroke.
Labels Customization
Use the following properties to configure the labels visualized for each data point:
ShowLabels(bool)—Defines whether the axis labels will be displayed.LabelOffset(Size)—Defines the offset of the labels from the points.LabelStyle(Stylewith target typeChartLabelAppearance)—Defines the style of the axis labels.
Scatter Point
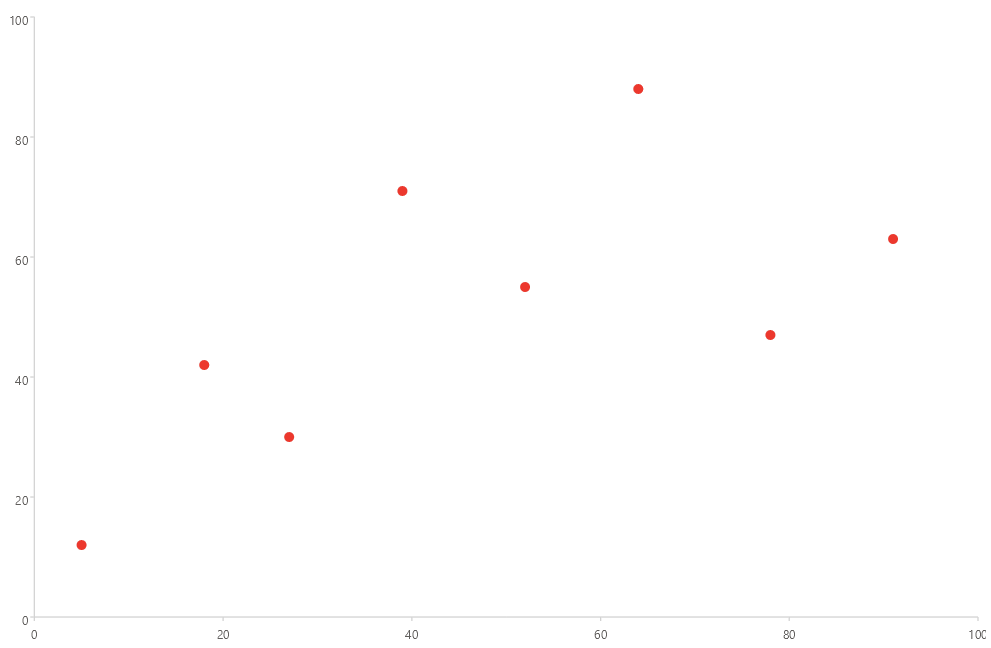
When plotting the PointSeries against two NumericalAxis instances and bind both HorizontalBinding and VerticalBinding to numeric members, the series works as a scatter point series. Use this setup to visualize the correlation between two numeric values. For more information, see Scatter Series.
Example
The following example shows how to define a PointSeries.
- Define the
PointSeriesand the chart definition in XAML:
<charts:RadCartesianChart>
    <charts:RadCartesianChart.BindingContext>
        <models:PointSeriesViewModel />
    </charts:RadCartesianChart.BindingContext>
    <charts:RadCartesianChart.Axes>
        <charts:NumericalAxis />
        <charts:NumericalAxis Location="Left" />
    </charts:RadCartesianChart.Axes>
    <charts:RadCartesianChart.Series>
        <charts:PointSeries HorizontalBinding="XValue"
                            VerticalBinding="YValue"
                            ItemsSource="{Binding Data}"
                            PointSize="10" />
    </charts:RadCartesianChart.Series>
</charts:RadCartesianChart>- Add the
chartsnamespace:
xmlns:charts="clr-namespace:Telerik.Maui.Controls.Charts;assembly=Telerik.Maui.Controls"- Add the data model:
public class PointData
{
    public double XValue { get; set; }

    public double YValue { get; set; }
}- Add the
ViewModel:
public class PointSeriesViewModel
{
    public ObservableCollection<PointData> Data { get; } = new ObservableCollection<PointData>
    {
        new PointData { XValue = 5, YValue = 12 },
        new PointData { XValue = 18, YValue = 42 },
        new PointData { XValue = 27, YValue = 30 },
        new PointData { XValue = 39, YValue = 71 },
        new PointData { XValue = 52, YValue = 55 },
        new PointData { XValue = 64, YValue = 88 },
        new PointData { XValue = 78, YValue = 47 },
        new PointData { XValue = 91, YValue = 63 },
    };
}
This is the result:
For a runnable example with the Cartesian Chart point series, go to the SDKBrowser Demo Application and navigate to the Charts > Series category.