New to Telerik UI for .NET MAUI? Start a free 30-day trial
.NET MAUI Cartesian Chart Null Values
Updated on Oct 7, 2026
In many scenarios some of the data points that are visualized in the Chart contain empty or null values. These are the cases when data is not available for some records from the used dataset.
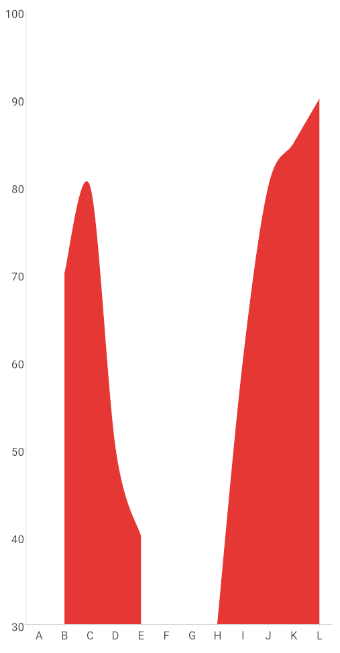
The Telerik UI for .NET MAUI CartesianChart series support null values and when a data point is null, the series will skip it and continue to the next available data point. The series will not render a point for the null value, the data point will be rendered as an empty space or gap.
Example
The following example demonstrates how to handle null values in a SplineAreaSeries.
- Define the Chart with
SplineAreaSeries:
XAML
<charts:RadCartesianChart>
    <charts:RadCartesianChart.BindingContext>
        <models:ViewModel />
    </charts:RadCartesianChart.BindingContext>
    <charts:RadCartesianChart.Axes>
        <charts:CategoricalAxis />
        <charts:NumericalAxis />
    </charts:RadCartesianChart.Axes>
    <charts:RadCartesianChart.Series>
        <charts:SplineAreaSeries HorizontalBinding="Category"
                                 VerticalBinding="Value"
                                 ItemsSource="{Binding Data}" />
    </charts:RadCartesianChart.Series>
</charts:RadCartesianChart>- Add the
chartsnamespace:
XAML
xmlns:charts="clr-namespace:Telerik.Maui.Controls.Charts;assembly=Telerik.Maui.Controls"- Define the data model and
ViewModel:
C#
public class ViewModel
{
    public ViewModel()
    {
        this.Data = new ObservableCollection<CategoryItem>()
        {
            new CategoryItem { Category = "A" },
            new CategoryItem { Category = "B", Value = 70 },
            new CategoryItem { Category = "C", Value = 80 },
            new CategoryItem { Category = "D", Value = 50 },
            new CategoryItem { Category = "E", Value = 40 },
            new CategoryItem { Category = "F" },
            new CategoryItem { Category = "G" },
            new CategoryItem { Category = "H", Value = 30 },
            new CategoryItem { Category = "I", Value = 60 },
            new CategoryItem { Category = "J", Value = 80 },
            new CategoryItem { Category = "K", Value = 85 },
            new CategoryItem { Category = "L", Value = 90 }
        };
    }

    public ObservableCollection<CategoryItem> Data { get; private set; }
}

public class CategoryItem
{
    public string Category { get; set; }
    public double? Value { get; set; }
}
This is the result:
For a runnable example with the CartesianChart null values scenario, go to the SDKBrowser Demo Application and navigate to the Charts > Features category.