New Reports and Web Components Support in Test Studio R1 2020

Summarize with AI:
Test Studio R1 2020 is out! With it Shadow DOM is no longer a problem at all. Sharing beautiful reports of your application and test automation quality has never been easier.
Let me picture for you a situation that you may already have been stuck into. While you automate your web tests, you clearly see some elements on the screen but you cannot find in the DOM tree of your application and you have no idea how to access them through your test scripts. You can use a recorder to record some steps against these elements but during execution, the test fails to locate them or performs the desired action on another element.
Sound familiar? Well, most probably the app under test uses “Web Components,” a technology that is gaining a lot of traction recently but is making the quality assurance engineer's life a lot harder.
Web Components Support

“Web Components” is a modern browser feature based on three main technologies:
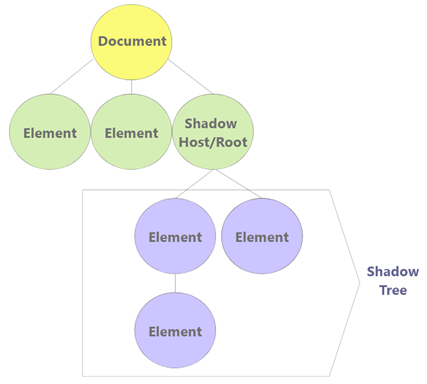
- Shadow DOM - allows the creation of a whole new encapsulated DOM attached to an element
- HTML templates - allows the reuse of markup templates by <template> and <slot> tags which are not displayed and rendered by the browser
- Custom elements - allows the creation of custom elements and is tightly integrated with the previous two technologies
Web Components are very powerful but extremely hard to automate. Test automation with a Shadow DOM is a challenge because the elements inside a Shadow DOM subtree don’t exist in the main DOM tree.
Fortunately, Test Studio provides out-of-the-box support, which ensures seamless and stable test automation with or without Web Components (Shadow DOM, templates or Custom elements) in your application. Test Studio identifies all Shadow DOM trees in the loaded page and records/executes any action, verification, real click or type against that element as if it is a regular element part of the main DOM tree.
Undoubtedly “Web Components” support is amazing news for all testers who automate, but we also have a pleasant surprise for managers. They usually need to use a lot of reports, and they want them beautiful, easy to create and green. Well, while the last part is up to the development team, Test Studio takes care of the first two.
Reports in the Executive Dashboard

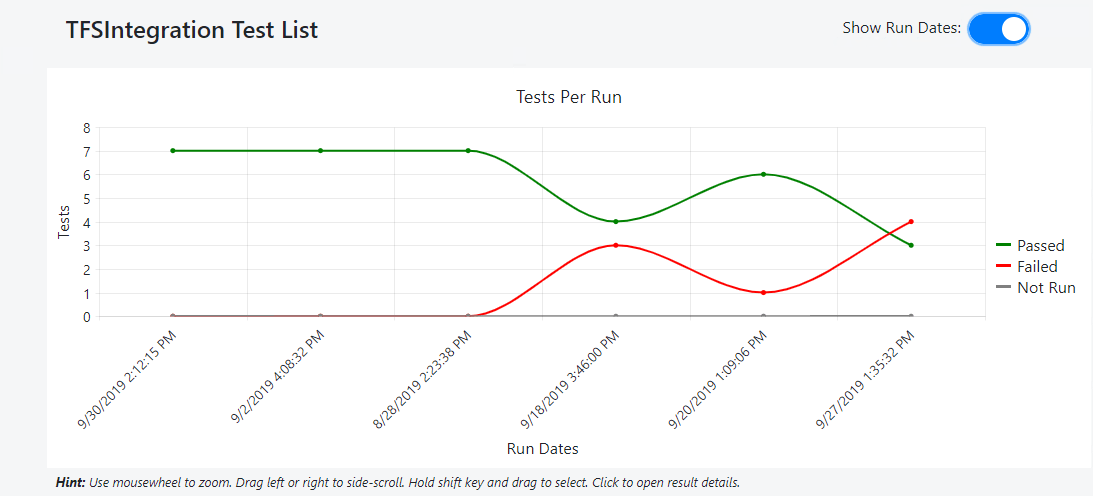
Test Studio Executive Dashboard is a web page that allows you to monitor test results reported from all testing agents. With this release, beautiful reports can be also generated inside the Executive Dashboard. Select a time period and one or multiple test lists, and the Executive Dashboard does the rest. All reports can be easily shared by just sending the link. Anyone can access it in their browser, no matter if they have active Test Studio license or not.
Along with these great new additions to Test Studio’s feature set, we also shipped a lot of improvements and bug fixes. You can take a look at the full changelog here.
You can download the latest Test Studio version from your account right now. Or if you're new to Test Studio, get started with a free 30-day full-featured trial today.
Happy testing!

Iliyan Panchev
Iliyan is a Senior Product Manager at Progress, responsible for the Telerik testing solutions, including Test Studio and JustMock. In the mid ’00s, he started his career in software development as a game tester because he loves video games, and
eventually he realized that breaking software is fun. He believes that a good Quality Assurance Engineer should be involved in all phases of the software development process. Iliyan, now as a Product Manager, has a new objective—to relieve the
QA engineer of the challenges associated with test automation and help them have more pleasant and rewarding workdays.
