
Debugging with Fiddler Everywhere 101

Summarize with AI:
Fiddler Everywhere not only lets you analyze the conversation between your client and Web Service, it gives you the fastest way to debug them both.
If you’re building a web service, a client for a web service or both, you’re going to get everything up and running faster with Progress Telerik Fiddler Everywhere (unless everything works the first time … and we both know that won’t happen). I’m actually selling Fiddler short here: If your application involves any kind of network traffic, Fiddler is going to be helpful because, once you start Fiddler Everywhere, it monitors all your outgoing and incoming network requests, not just your HTTP traffic.
In this post, though, I’m going to focus just on using Fiddler Everywhere when building web services and their clients. Fiddler not only gives you the ability to debug what’s really going on in the conversation between your client and your server but, also, the ability to use your own messages to support debugging and testing. Fiddler Everywhere is the fastest/easiest way to trigger a debugging session with your service, for example, along with being the most efficient way to debug special cases.
Exploring Problems
Installing Fiddler Everywhere is easy (download it from your Telerik account). However, when you start Fiddler up, it’s initial display can be … daunting. These days, there’s a ton of traffic going in and out of your computer and Fiddler, by default, shows all of it.
However, typically all you want to see is what’s happening with the client and web service that you’re currently working on. Your first step, then, is to narrow that list of messages down to just the requests sent by your client and the responses returned from your service. To do that, click on the Filters button at the top of Fiddler’s list of network messages to open the Filters dialog.
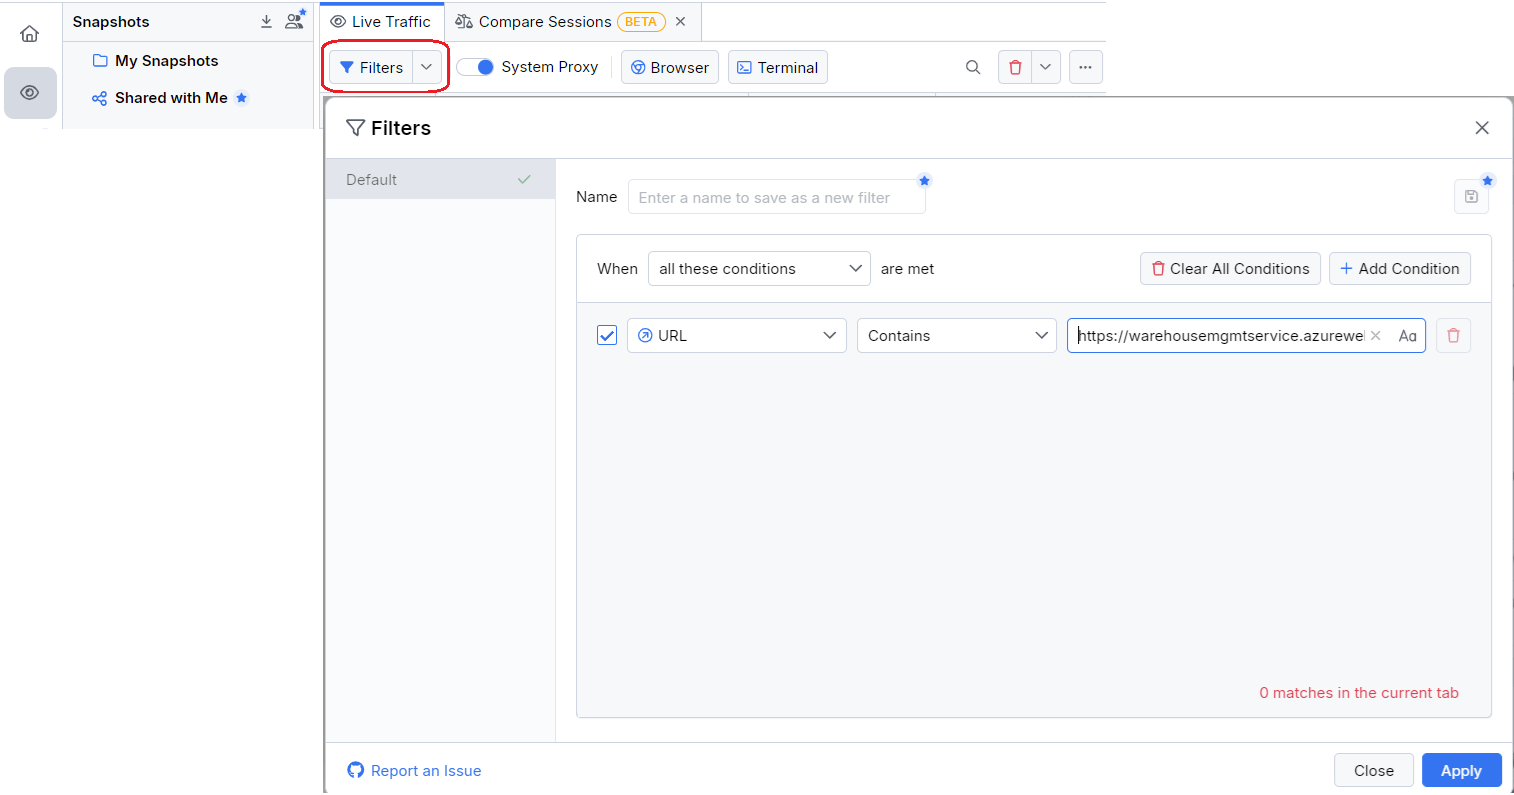
In that dialog, you can use multiple parameters to filter the messages that Fiddler shows you, but the parameter you probably want is the default one: URL.
To limit your messages to those between your client and service, just copy the URL that your client is using to call your web service and paste it (or some part of it) into the textbox on the right of the filter. At the bottom of the dialog, you’ll get a message saying how many of the current messages match your filter. (If that number is 0, don’t panic! It just means that you haven’t run your client yet and there are no messages to display.)
After setting the filter, click the Apply button in the lower right corner of the Filters dialog to close the dialog and return to the main Fiddler UI.
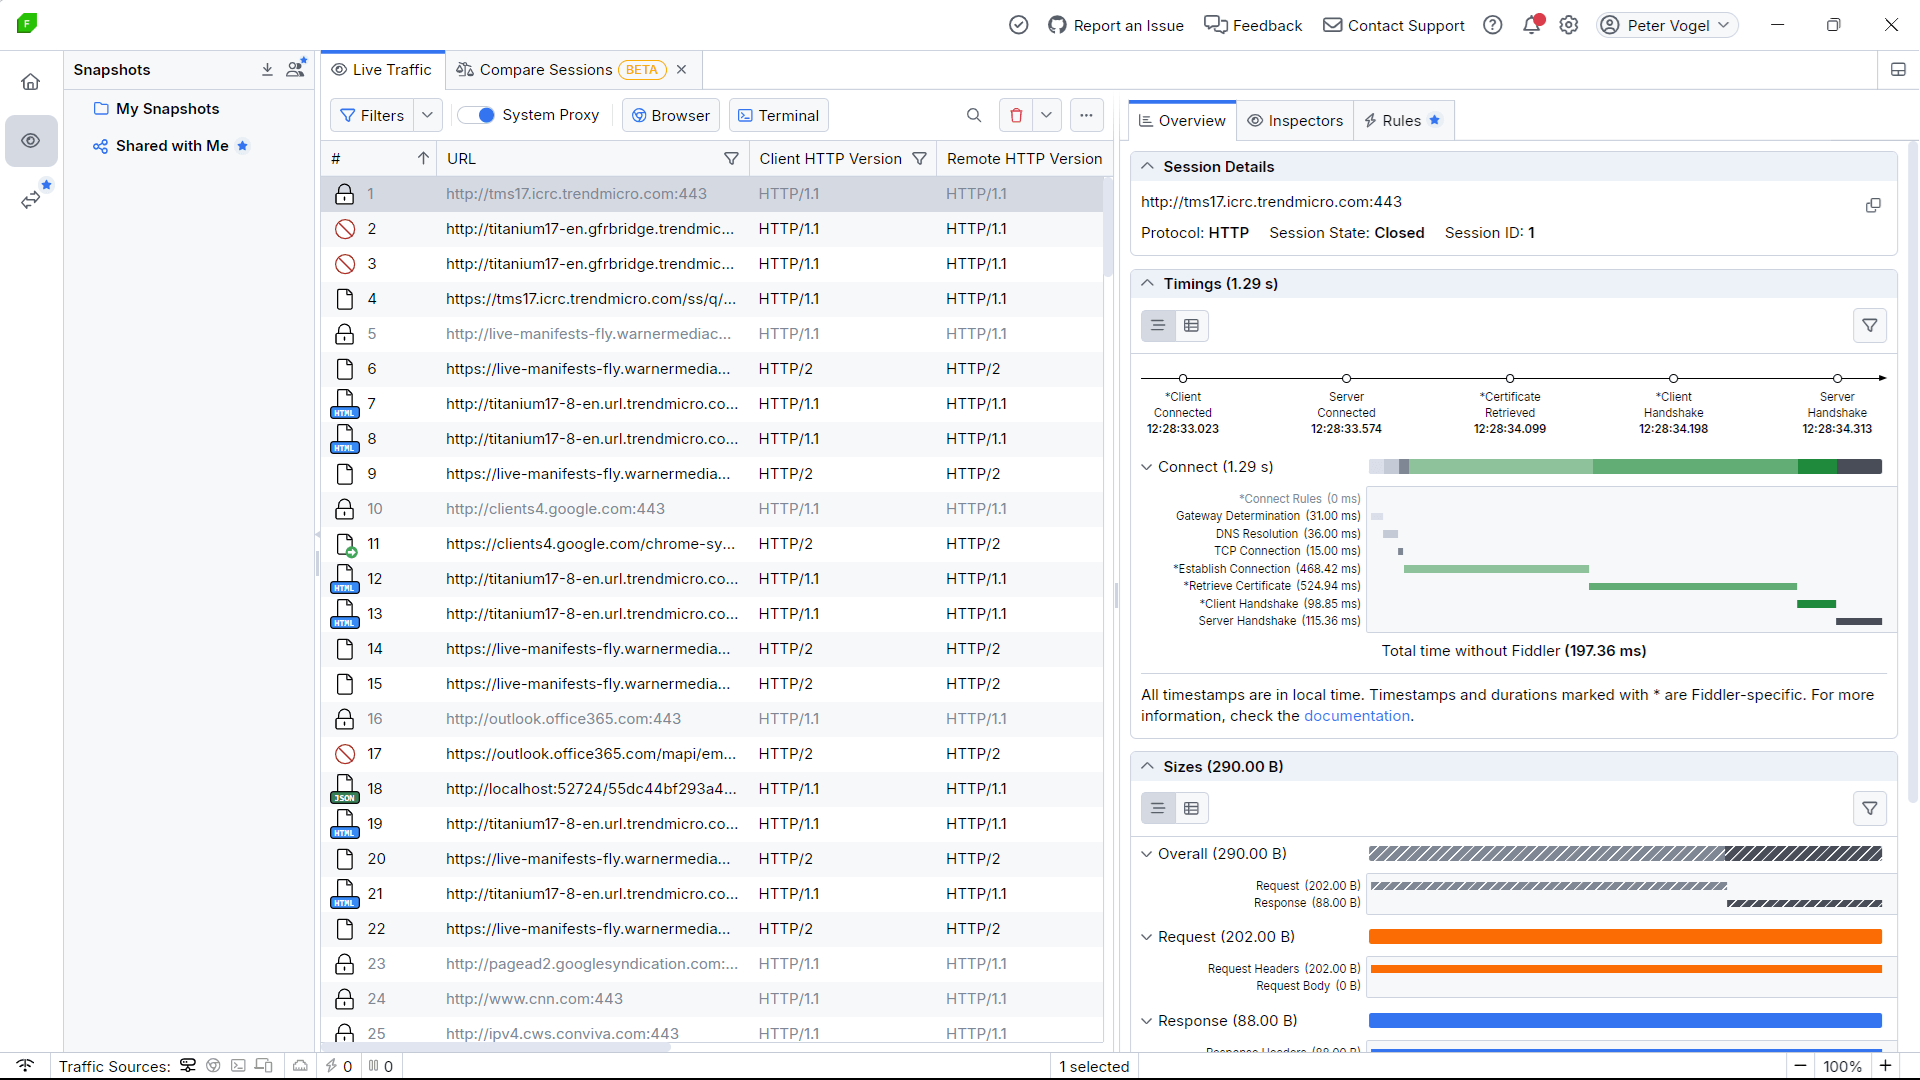
You can now switch to your client and have it call your web service to display the request message sent by your client and the response returned by your service (Fiddler bundles those up into a single entry in the message list). It doesn’t matter, by the way, if your client is a desktop app or a client-side app running in your web browser: Fiddler sees everything.
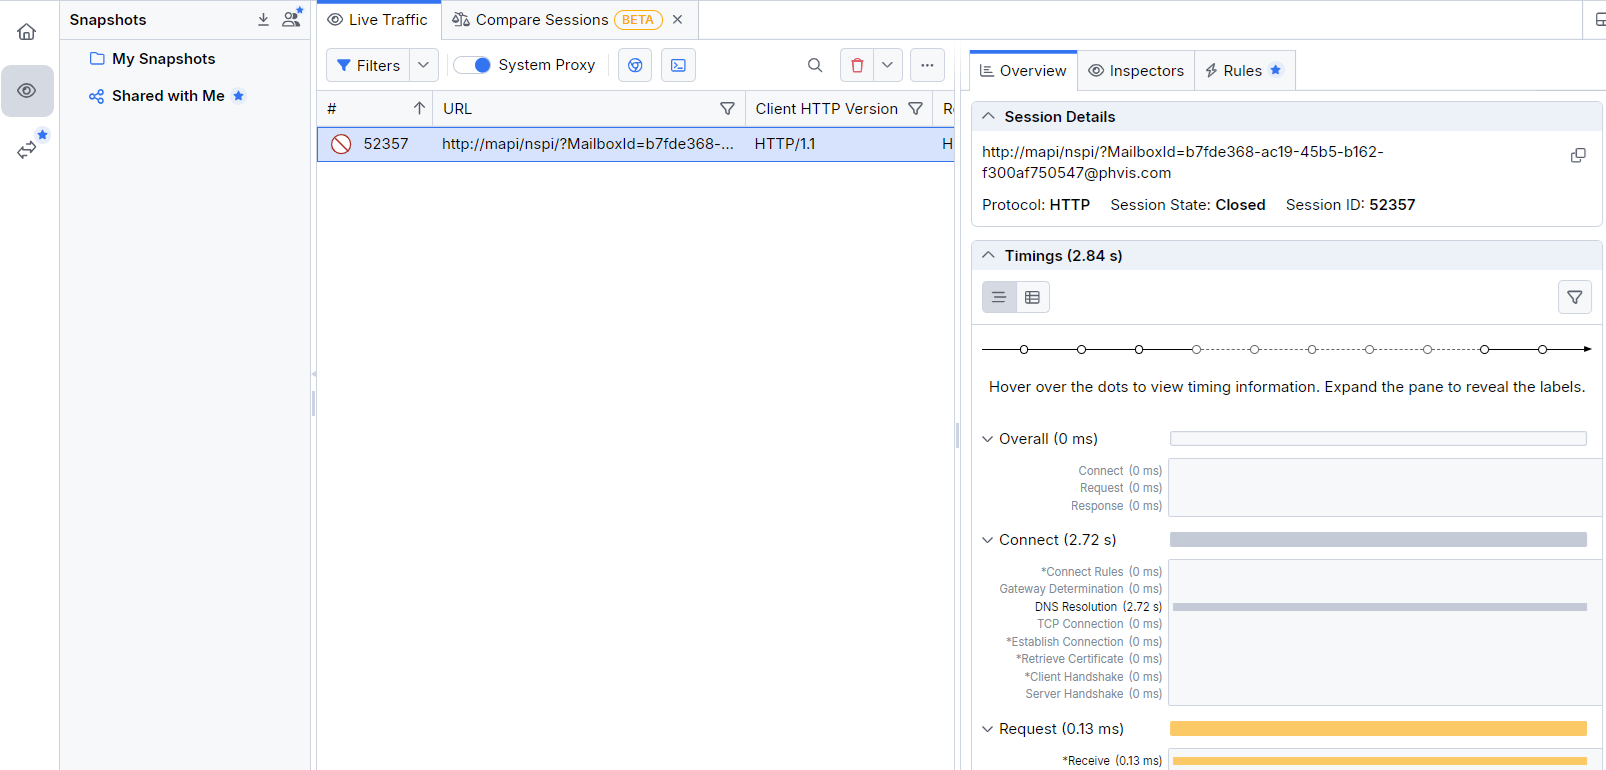
If you’re lucky, your client’s call will succeed and you’ll get a display like this:
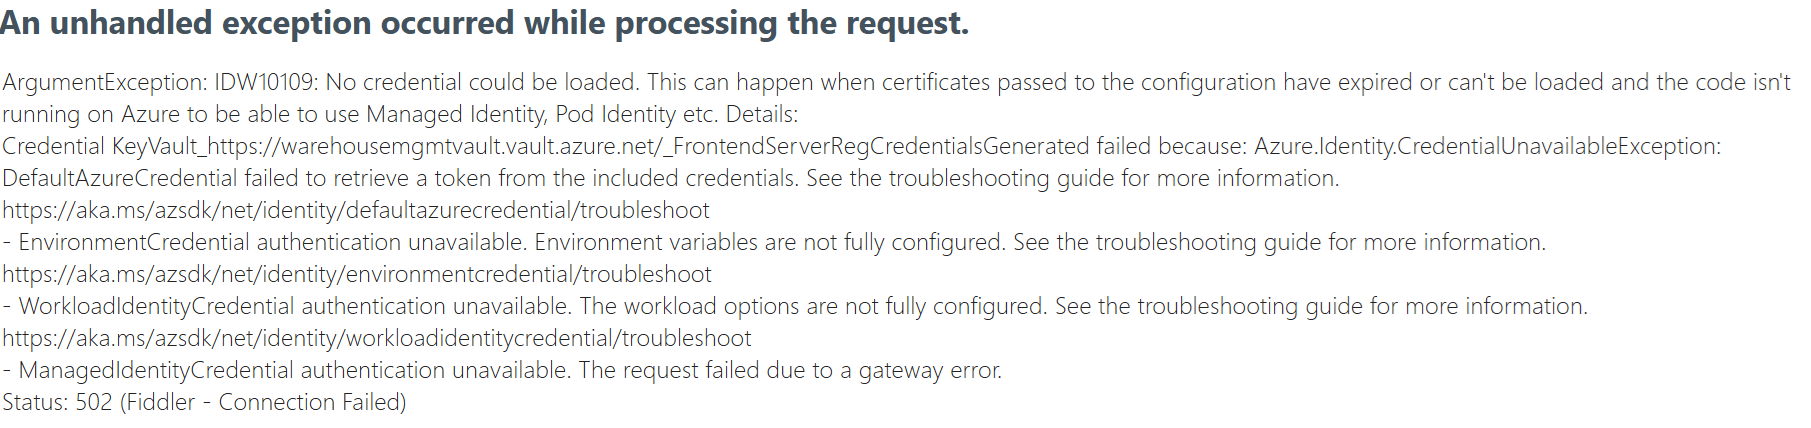
But, if everything was working, you wouldn’t be using Fiddler, would you? It’s more likely that you’re using Fiddler because you have a problem and your client application is displaying a message like this (in this case, the message is from a browser-based client accessing a secured Azure web service):
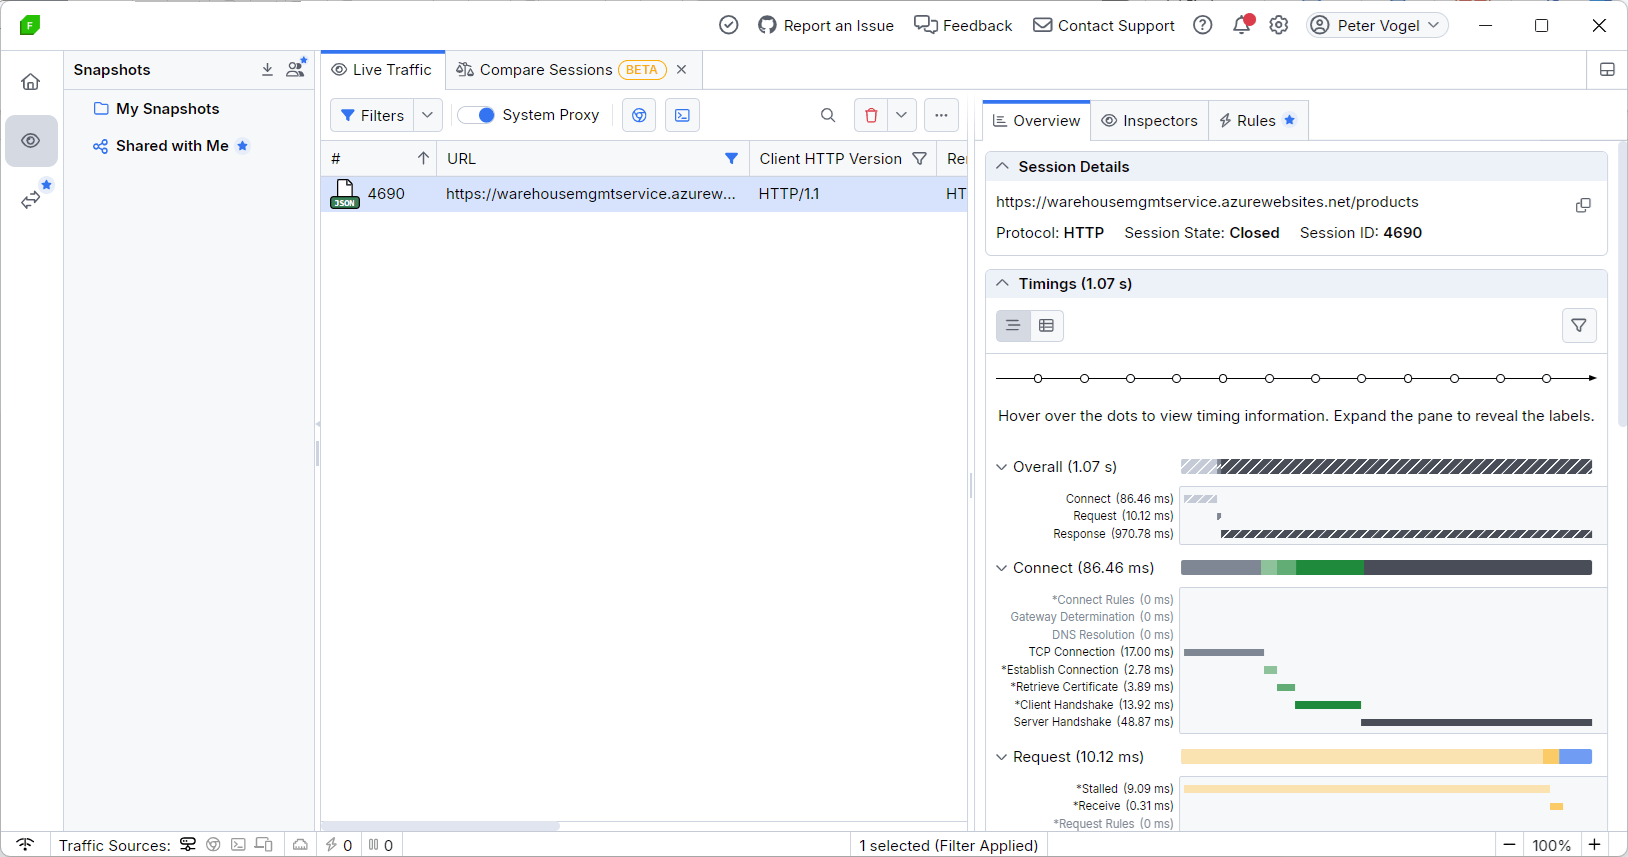
If your client is sending and receiving lots of messages that work just fine, you can re-filter your message to focus on your “problem messages.” To focus on your error, return to the Filters dialog, set the filter type to Status Code, and enter the status code that your client is getting into the value text box (502 in this case). The middle dropdown list will automatically switch to “is equal to” when you select Status Code as your parameter.
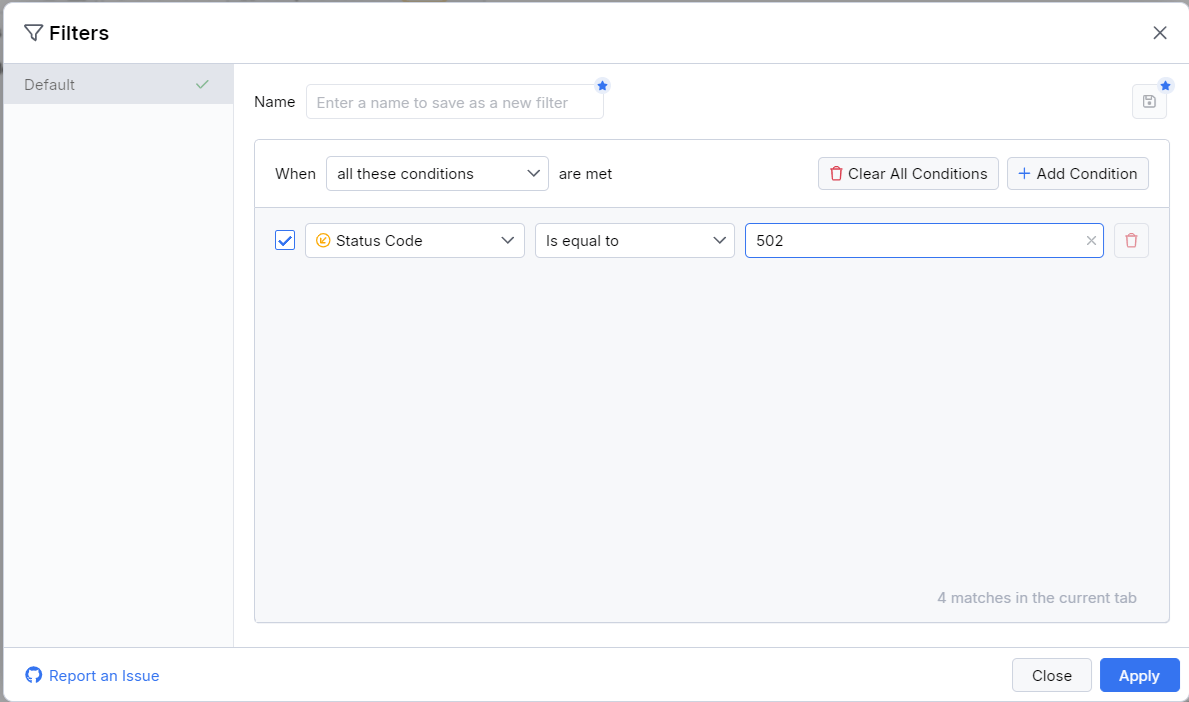
Now you’re focusing on the messages between your client and service that you care about. The panel to the right of the message list in Fiddler Everywhere will let you explore that failing exchange.
Exercising Your Client and Service
But building an app isn’t always about tracking down bugs: As you write new code in either your client or your service, you need to run it to see what it does. Fiddler can make you more productive in running the code in both your client and service by performing the first step in testing: Isolating the code you want test.
One caveat: Fiddler Everywhere is great for doing the interactive, exploratory testing that lets you diagnose and fix the problems between your client and service. This is the kind of testing that precedes developing suites of automated regression tests. Fiddler isn’t a replacement for a package that supports creating test suites to be run on a schedule or when new code is checked in. (Advertising plug: The Progress offering in that area is Test Studio for APIs, which you can use starting with unit testing and all the way through to integration tests.)
Testing Your Service
The cleanest way to test your service is to isolate it from your client so you can see how your service responds to the messages it receives.
The easiest way to do that is to reuse an existing message in Fiddler’s message list: Just right-click on the message of your choice and, from the popup menu, select Replay. Fiddler will send your message to the service and display the resulting messages as new items in the message list. You can now modify your service and test how well (or sadly) your changes work without having to restart your client and navigate through its interface (as I said earlier: this is also the fastest, easiest way to start a debugging session with your service).
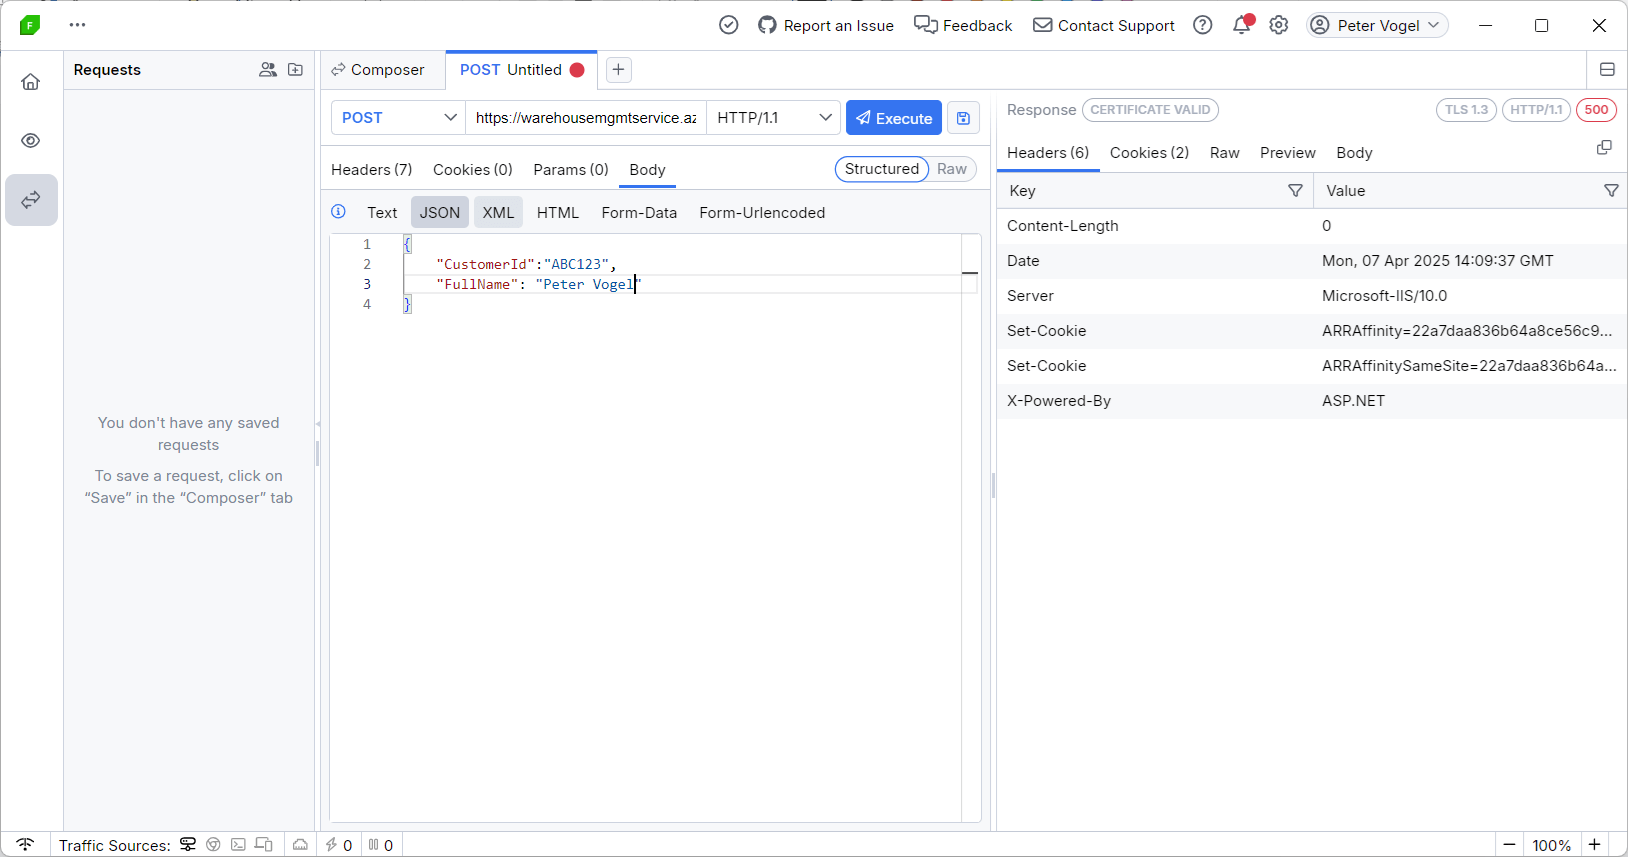
If you have a Pro license, you can also modify an existing request/response message to see what happens when, for example, your service is sent a malformed message—and do that without torturing your client into sending a malformed message.
All you have to do is right-click on the message and select Edit in Composer to open the Composer window. In Composer, you can modify one or more of the message’s method, URL, headers, HTTP version and payload/body. Make your changes and click the Execute button at the top of composer to send your revised message to your service.
Testing Your Client
You can also, with the Pro license, simplify exercising the changes in your client by isolating your client from your service. You do that by defining rules in Fiddler that define responses to client requests (this feature was formerly called Auto Responder). Now, when your client sends a message, Fiddler will catch it and send a response for you. This lets you, for example, see how your client responds to an unfortunate status code (e.g., a 503 “server too busy” response) without finding some way to force your service to send that status.
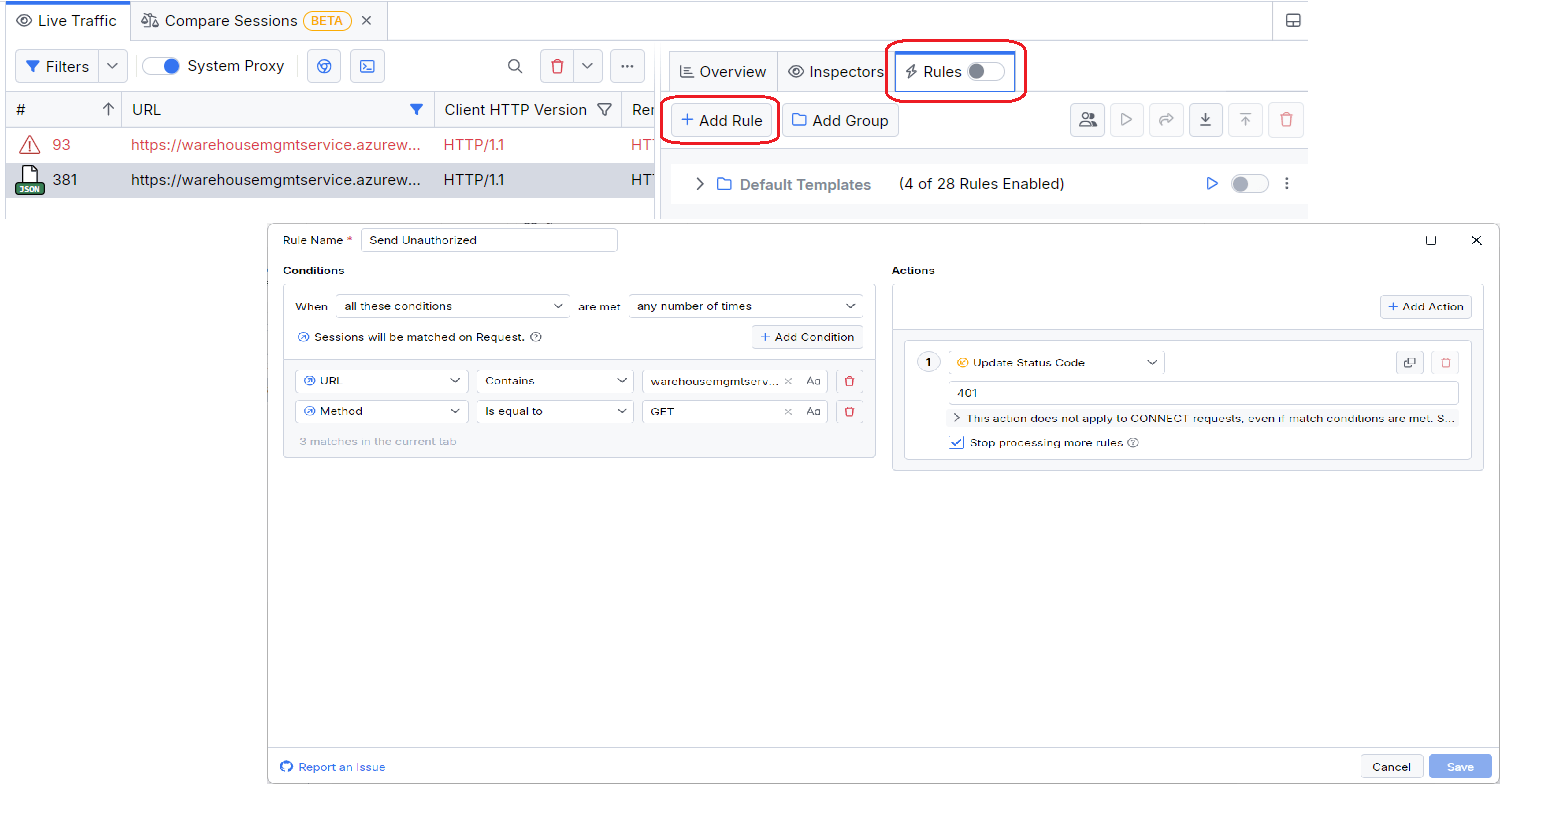
To add a rule, switch to the rules tab in Fiddler’s right panel and click on the Add Rule button to a dialog to generate your rule. Once that rule dialog is open, you first need to specify a condition that will invoke a rule—in many cases that will be the URL and method that your client is using when invoking your service (use the Add Condition button at the top of the tab to add another condition).
After you’ve added a connection to specify what requests from your client you want to Fiddler to respond to, your next step is to add an Action that specifies the message to be sent to your client. You do that with the Add Action on the right side of the Rules dialog.
You can use actions to either modify the client’s request message to be sent to the service or the response to be sent to the client when the rule’s conditions are met. This example creates a rule that returns a 401 unauthorized response for any GET request sent from my client:
Your last steps in creating a rule are to give your rule a name and click the Save button in the lower right of the Rules dialog. Your new rule will be added to the list in the Rules tab and is ready to be used (by default, Fiddler ignores your rules until you want to use them).
To use your rule, you need to first enable using any rules: Set the toggle at top of the Rules tab. With rules now enabled, you then selectively enable the rules you want to use to exercise your client. Now, when you run your client, Fiddler Everywhere will intercept any requests that meet your rule’s condition and send back the message you specified in your action (in my case, that’s an unauthorized status code so I can see what problems that creates in my client).
You’ve now got the tools you need to analyze the conversation between your client and service, plus the ability to perform the key task in testing any code: Isolating the component under test. Now you just, you know, get them to work.

Peter Vogel
Peter Vogel is both the author of the Coding Azure series and the instructor for Coding Azure in the Classroom. Peter’s company provides full-stack development from UX design through object modeling to database design. Peter holds multiple certifications in Azure administration, architecture, development and security and is a Microsoft Certified Trainer.
Related Posts
Comments
All articles
Topics
Web MobileMobile
Desktop
Design
Productivity
People
