
5 Features of Fiddler Everywhere You May Not Know About

Summarize with AI:
Creating a valid (and useful) set of stress tests for your Web Service is ridiculously easy in Fiddler Everywhere … provided you know about the features that make that test possible.
When people show you how Progress Telerik Fiddler Everywhere works, it seems to me that the examples don’t show you nearly enough of what Fiddler can do for you. I’m going to walk through doing a standard stress test for a Web Service with Fiddler and, along the way, show you a bunch of features that I don’t think you know about.
In order to stress test my service, I first need to isolate it—remove my client application from the equation to make my service the “component under test.” Fiddler is perfect for that: I can call my service from Fiddler without having to invoke my client.
I also want to isolate the messages related to my test so I also set up a filter in Fiddler Everywhere to limit the message list to requests and responses to my service. (That way, I don’t have to look at all the other network traffic that Fiddler catches … and Fiddler captures everything).
Getting Authenticated
My clients are part of my stress test, but they can still be useful. To begin my test, I need a request and, while I can use the Fiddler Everywhere Composer to create my test message, I need that message to have a valid authentication header to get past my service’s security. That sounds … challenging because I’m testing against a Web Service running in an Azure App Service that I’ve locked down with App Registrations and Managed Identities.
Fortunately, that’s easier than you might think because I have both a client-side application and a server-side application that are successfully accessing my service and retrieving the necessary authentication tokens. The easiest way for me to get the authorization tokens I need is to have one of my clients generate a request and grab the token I need from that request.
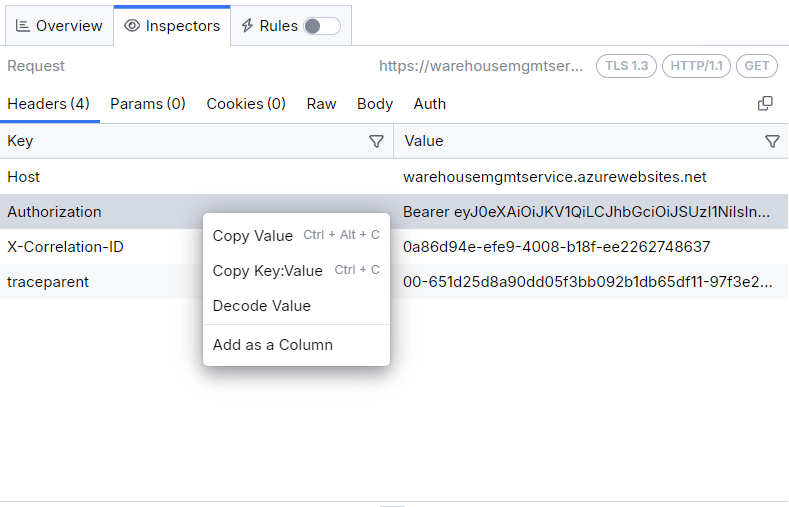
To do that, I start Fiddler Everywhere and then run one of my clients once, having it access my service. In the resulting list of messages from that run, I select a message that successfully retrieved content from my service and, in the panel on right side of the Fiddler window, switch to the message’s Inspectors tab.
Within the Inspectors tab, I select the Headers tab to display all the headers generated by my client. To get the security header I need for my test message, I just right-click on the Authorization header in the tab’s list and select Copy Value to copy the access token from the header. I’m now ready to create my test message.
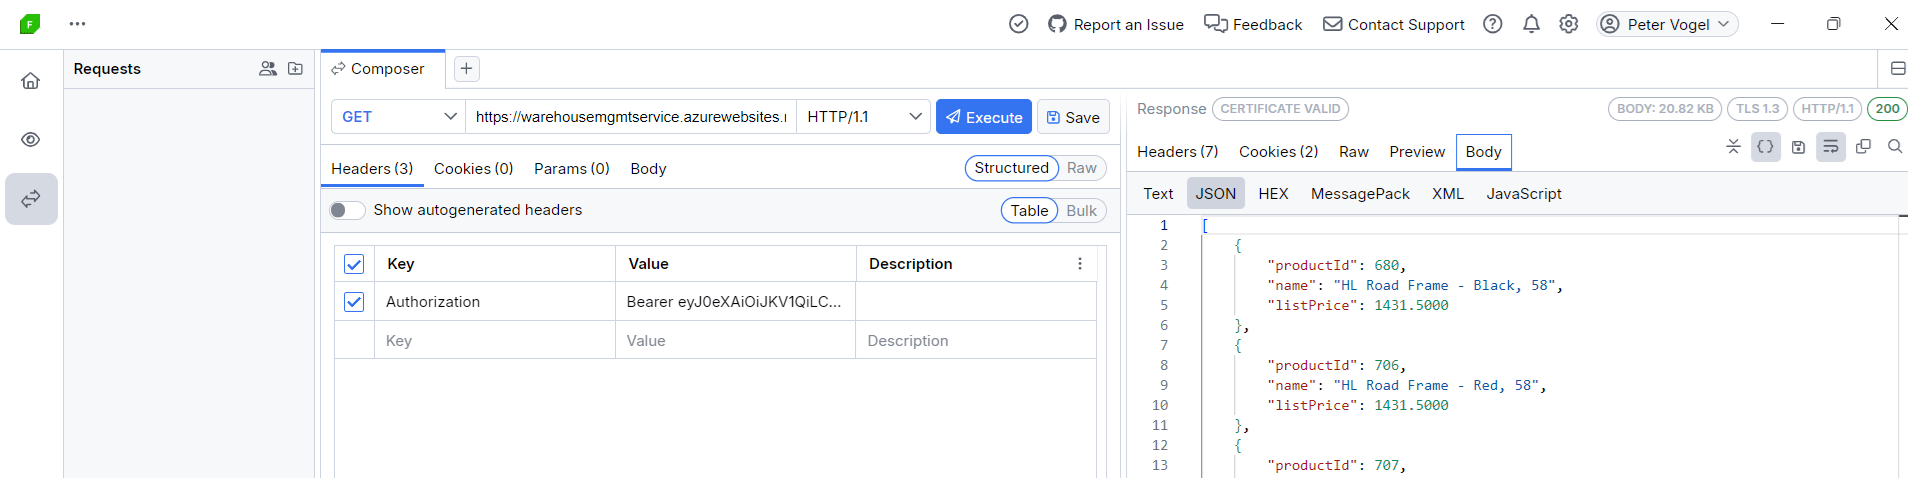
To create my test message, in the menu bar down the left side of Fiddler, I click on the bottom icon to open the Fiddler Composer tab. That tab shows me a default method, URL and protocol for my request, along with a blank list of headers.
The list of headers has an empty row for me to start with so that’s where I add my Authorization header. In the first column (called Key), I start typing “Authorization.” Fiddler immediately displays a dropdown list of standard header names. I just select the rest of the Authorization header name when it appears in the list. I then tab over to the Value column and paste in the value I copied from my original message.
I finish by setting my test request’s method (GET), the URL for my service (also copied from my client’s message) and protocol (HTTP 1.1). With those in place, I click the Execute button at the top right of the Compose tab and get the result of sending my messages to my service in the pane on the left.
But, in a stress test, I’m not really interested in what that message has retrieved but how well my service is doing when it processed the message. Before checking on that, I recognize that I could need this message again, so I click the Save button in the upper-right corner of the Composer tab and save this message under the name “Basic GET request.”
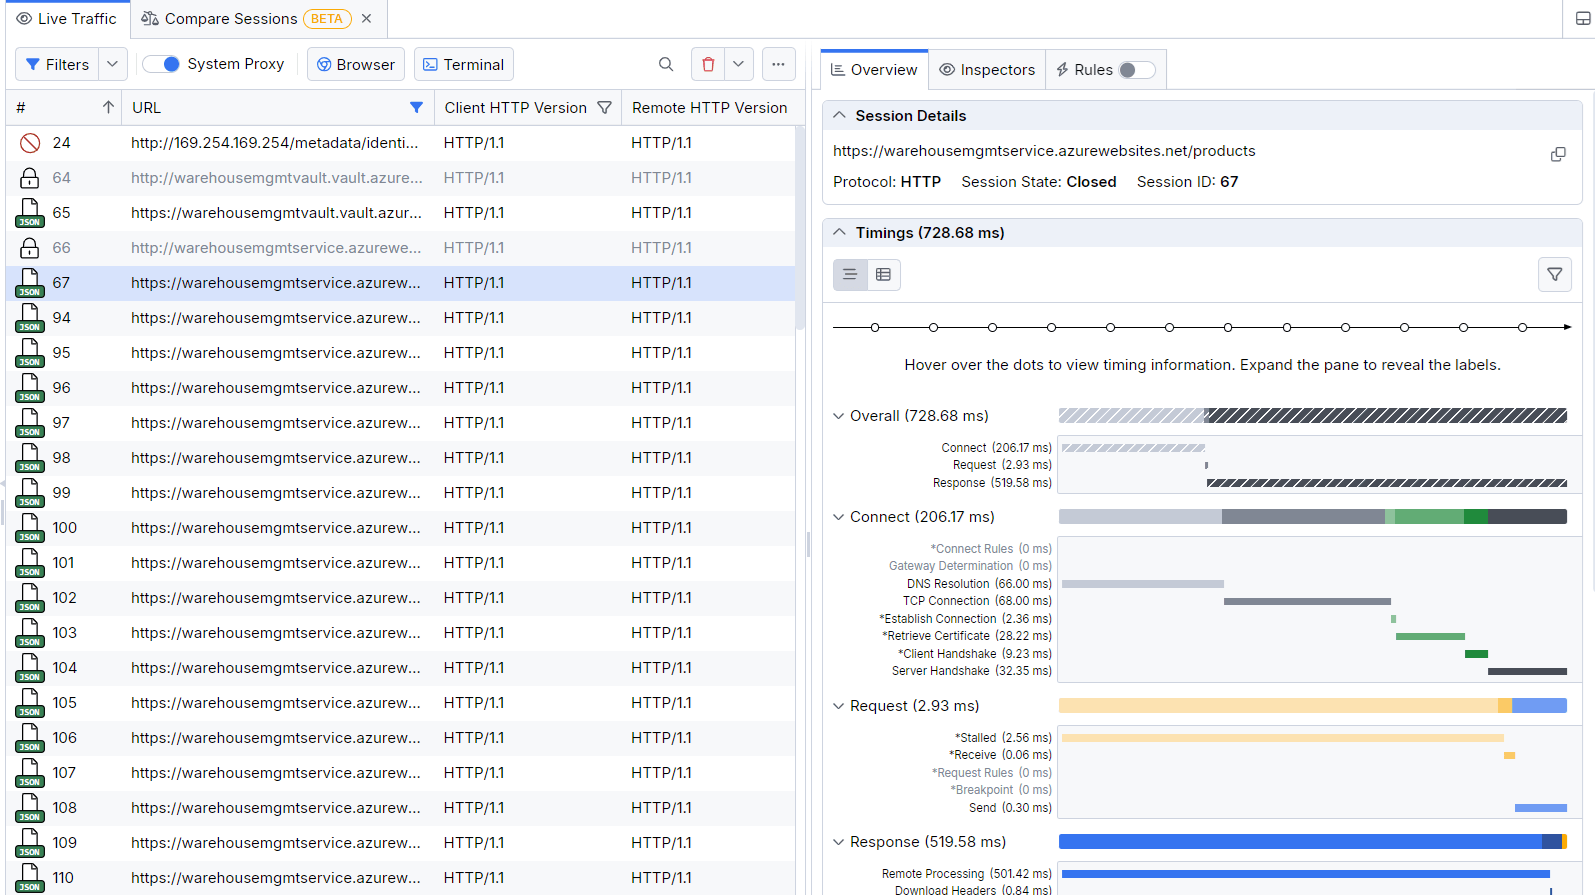
Now, to see how well my request’s processing went, I switch to the Fiddler Live Traffic tab (the eye icon in the middle icon of the menu down the left side of Fiddler) to see my message and, in its Overview tab, how well the message did.
Stress Testing Your Service
And the statistics look pretty good. But that’s just one request—everything looks good if you set the bar low enough. I want to see what my service’s capacity is: How well does my service do when it gets multiple, simultaneous requests.
To do that, I just right-click on may sample message in the message list and select Advanced Replay. In the Advanced Replay dialog, I can set the number of requests I want to make (I picked 100) and whether I want those requests sent in parallel or in series (I picked “Parallel”).
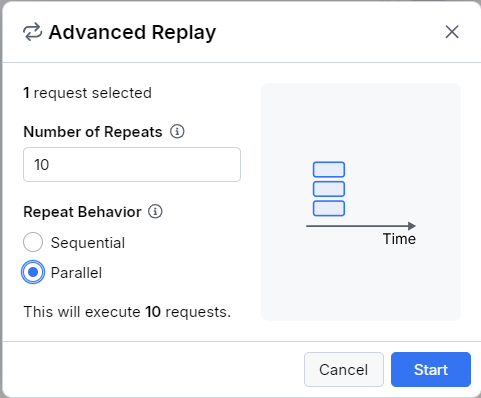
And now, just by clicking the dialog’s Start button, I can see what happens when my service gets 10 simultaneous messages.
Analyzing Conversations: Grouping Messages
Sure enough, when I switch back to the Live Traffic tab in Fiddler Everywhere, I can see all 100 of my requests. I can select on any single message to see how it did but, in a capacity test, I want to know I want to know how well the messages succeeded as a group (is my service is able to meet any SLAs I’ve committed to). Fiddler will tell me that, too.
Initially, in my message list, only the message I used to trigger my test is selected, with its details presented in Fiddler’s Overview tab on the right. To see the results from all of my messages, I click on the first message of my 100 requests and, holding down the shift key, use my down arrow to select the rest of the messages.
Fiddler now displays the summary results of all my selected messages in the panel on the right, in three groups: a bar graph showing response times, followed by a bar graph showing response sizes and, at the bottom, a set of summary statistics.
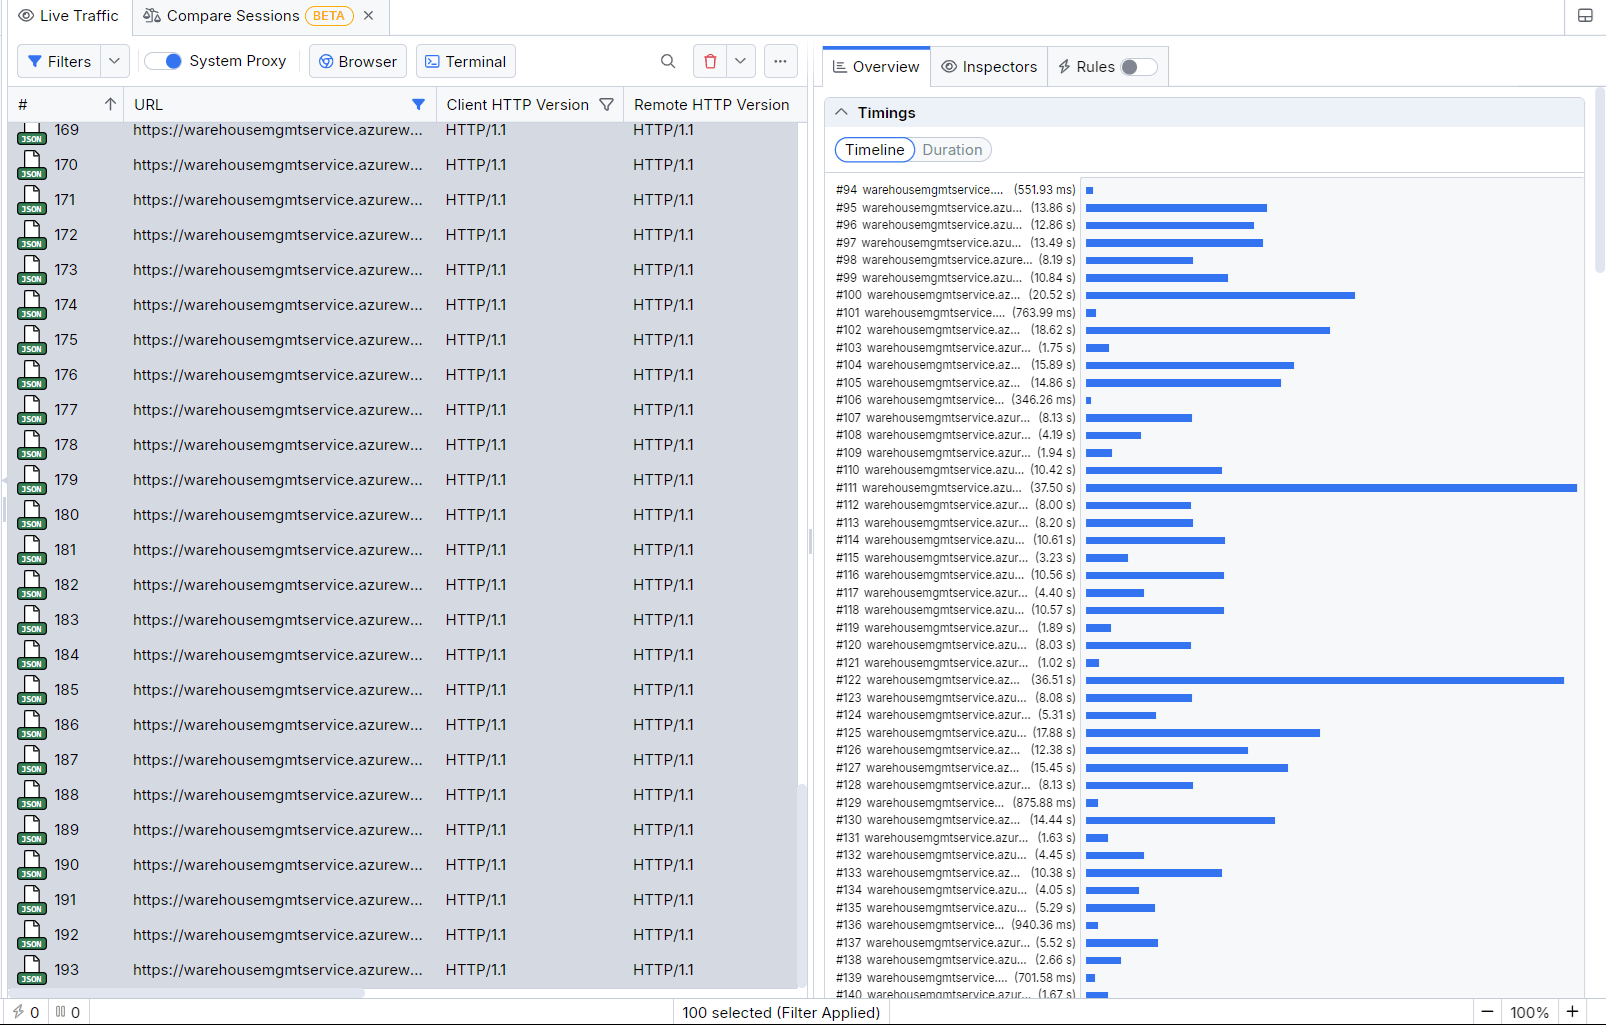
In this stress test, just looking at the initial bar graph, some of my requests completed quickly (about 300 milliseconds—yay!) and others took … longer (as much as 37 seconds—boo!).
If I scroll down to the next section in the overview panel, I can see in the bar graph showing the size of the responses that two response bodies were much smaller than the rest. Since all 100 requests were identical, all 100 responses should have been, too.
If I scroll all the way down to the bottom of the panel, I get my summary statistics for my tests. Those statistics show that, while my test took about 37 seconds to complete, my median and average times to complete for any single request were much lower: 7 seconds and 8.5 seconds (roughly). Those statistics also show that I was able to push about three transactions through per second. But those statistics also show that two of my requests failed with 500 (internal error) status codes which explains the two small response sizes.
If I can’t reasonably expect my service to get 100 simultaneous requests then, obviously, I have some work to do (maybe it’s time to implement a caching strategy in my service or, since my service is running in an Azure App Service, scale up or turn on scaling out).
Before going on, though, it’s worth pointing out that, while I’m using this feature for 100 identical messages, Fiddler Everywhere will generate summary results for any group of messages. That’s important because your client probably doesn’t send just one message to your service—your client is probably engaged in a conversation with my service that involves an exchange of multiple messages.
Being able to select all the messages in a conversation between your client and service enables you to analyze the conversation as a group and can go a long way to understanding the performance characteristics of your application as a whole. It will answer, for example, which of the requests and responses in your application are having the biggest impact on my client’s response time.
Keeping Track
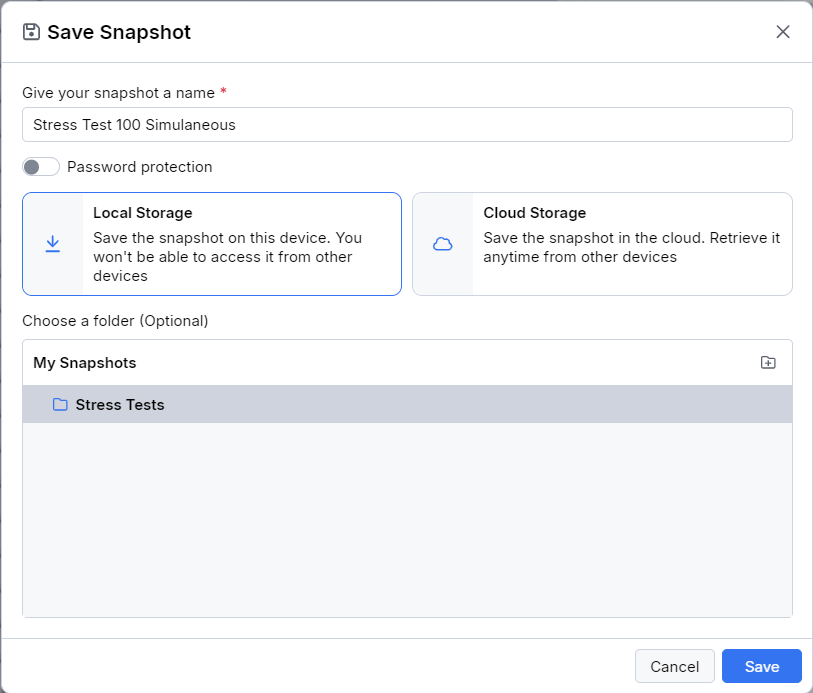
Obviously, this data is important, if only to compare to my results after I make my changes to my service. I can save these results as a snapshot by right-clicking on my message list and selecting Save. That opens the Save Snapshot dialog where I can give my snapshot a name and pick a folder to save those messages with their results in before clicking the Save button in the dialog’s lower right corner (the snapshot will contain only my currently selected messages).
I can now shut Fiddler down, make my changes to my service and, when I get around to it, restart Fiddler to rerun my stress test. To rerun my test, I first double-click on my snapshot’s name in Fiddler’s Snapshots list on the right to restore my saved messages (with their statistics) into a new tab in Fiddler’s messages list.
To run all my snapshot’s requests again, I select them all with Ctrl + A (Windows)/Cmd + A (macOS), right-click on the selected list and select Replay from the popup menu. As my messages execute, I switch to the Fiddler Everywhere Live Traffic tab to see the results of my test. To get results from my new requests that I can compare to my original results, I select all of the re-executed messages by right-clicking on any one of the re-executed messages and choosing Select | Duplicate Requests from the popup menu. That generates the summary statistics for my new run of my snapshot in Fiddler’s Overview tab on the right.
Reviewing the Results
I’ll cut to the chase: My service did much better after implementing my changes (I added a server-side cache). Not only did all my requests succeed, I cut both my median and average response times in half, with my longest response taking under five seconds. Since those are well under the values specified in my SLA (and my SLA also specifies that I can reasonably expect to get only 25 simultaneous requests), I can move on to the next problem.
But first, I’ll save the new run as another snapshot so that, at appraisal time, I can pull them these statistics to demonstrate just how wonderful I am.
Give It a Try for Yourself
Explore these features and more with your own free 10-day trial of Fiddler Everywhere.

Peter Vogel
Peter Vogel is both the author of the Coding Azure series and the instructor for Coding Azure in the Classroom. Peter’s company provides full-stack development from UX design through object modeling to database design. Peter holds multiple certifications in Azure administration, architecture, development and security and is a Microsoft Certified Trainer.
Related Posts
Comments
All articles
Topics
Web MobileMobile
Desktop
Design
Productivity
People
