.NET MAUI Cartesian Chart Annotations
Annotations are visual elements that mark specific values or ranges in the plot area of the Cartesian Chart. Use annotations to highlight a target value, a threshold, an acceptable range, or a period of interest. Annotations don't depend on the series data, so they stay in place when the data changes.
To add annotations, populate the Annotations collection of the RadCartesianChart. Each annotation must reference an axis that belongs to the same chart, and an annotation instance can't belong to another chart.
Annotation Types
The Cartesian Chart supports the following annotation types:
| Annotation | Description |
|---|---|
ChartGridLineAnnotation | Draws a line across the plot area at an exact axis value or category position. |
ChartPlotBandAnnotation | Draws a band between two exact axis positions. |
ChartCategoricalPlotBandAnnotation | Draws a band over a range of categories and includes the complete slots of the endpoint categories by default. |
Configure Common Annotation Properties
All annotations share properties that control their visibility and rendering order. Use the following properties to configure any annotation:
IsVisible(bool)—Defines whether the annotation is drawn. The default value istrue.Opacity(double)—Defines the opacity of the annotation, from0to1. The value multiplies the alpha channel of the brushes. The default value is1.Layer(enumof typeTelerik.Maui.Controls.Charts.ChartAnnotationLayer)—Defines whether the annotation renders below or above the series. The available options are:BelowSeries—Draws the annotation below the grid and the series. This is the default value for plot bands.AboveSeries—Draws the annotation above the series and below the axes. This is the default value for grid lines.
ZIndex(int)—Defines the drawing order within the layer. Annotations with equal values keep their order in the collection.Style(Style)—Defines a style that merges with the implicit and theme styles of the annotation.
Configure the Axis and Stroke
Grid line and plot band annotations position themselves against an axis and support a stroke. Use the following properties to set the axis and customize the stroke:
Axis(Telerik.Maui.Controls.Charts.ChartAxis)—Defines the axis against which the annotation is positioned. The axis must belong to the owning chart.Stroke(Brush)—Defines the stroke brush. The current theme provides the default brush.StrokeThickness(double)—Defines the stroke thickness in device-independent units. The value must be zero or greater, and0hides the stroke. The default value is1.StrokeDashArray(DoubleCollection)—Defines alternating dash and gap lengths in device-independent units. An empty collection draws a solid stroke. A pattern with an odd number of values repeats to form an even-length pattern.
The
StrokeandFillproperties of annotations support onlySolidColorBrushvalues.
Mark a Value with a Grid Line
The ChartGridLineAnnotation draws a line across the plot area. Use it to mark a threshold, a target, or an average value. Set the following property to position the line:
Value(object)—Defines the position of the line. The value can be a number, aDateTime, or a category, depending on the type of theAxis.
When the Axis is horizontal, the line is vertical. When the Axis is vertical, the line is horizontal.
Highlight a Range with a Plot Band
The ChartPlotBandAnnotation fills the area between two positions on an axis. Use it to highlight an acceptable value range or a time period. Use the following properties to configure the band:
From(object)—Defines one endpoint of the band.To(object)—Defines the other endpoint of the band. WhenFromandToare equal, the band has zero area.Fill(Brush)—Defines the fill of the band. The current theme provides the default brush. SetFillto{x:Null}to draw only the stroke of the band.
The band normalizes reversed endpoints according to the axis order. The band draws a stroke only at the From and To boundaries; the edges parallel to the axis have no stroke.
On a CategoricalAxis, the ChartPlotBandAnnotation boundaries are the category positions, which are the centers of the category slots. To include the complete slots, use the ChartCategoricalPlotBandAnnotation.
Highlight Complete Categories
The ChartCategoricalPlotBandAnnotation extends the ChartPlotBandAnnotation for categorical axes. Use the following property to define how the band treats the endpoint categories:
CategoryBoundaryMode(enumof typeTelerik.Maui.Controls.Charts.ChartCategoryBoundaryMode)—Defines whether the band includes the complete category slots or cuts at the category positions. The available options are:- (Default)
WholeCategorySlots—Includes the complete slots of both endpoint categories. WhenFromandToare equal, the band highlights one category. CategoryPositions—Uses the exact plotted positions of the endpoint categories.
- (Default)
Add Annotations to the Chart
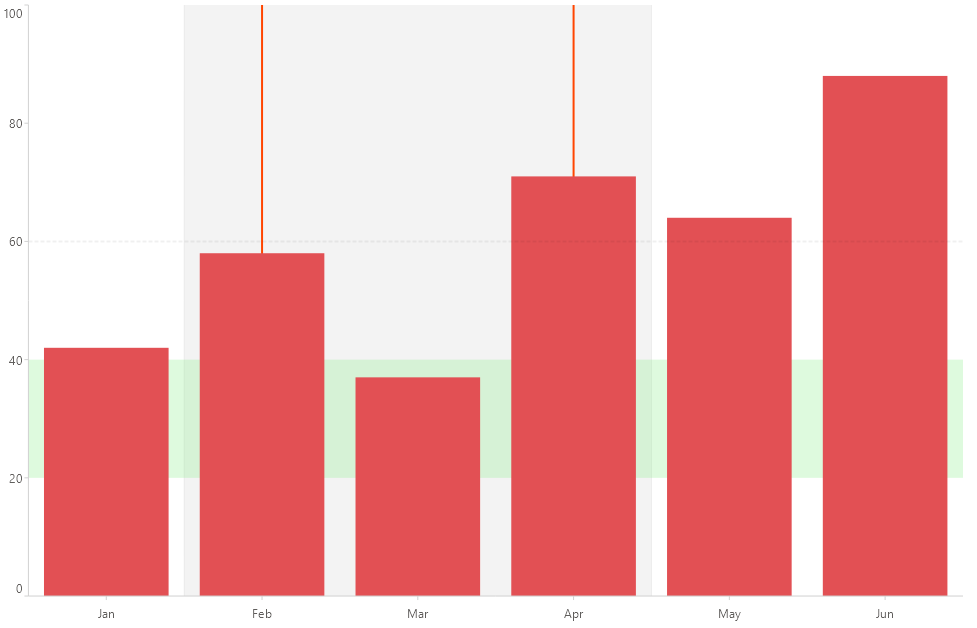
The following example shows a BarSeries with a categorical plot band, a stroke-only plot band, a value range band, and a dashed threshold line.
-
Define the chart, the axes, the series, and the annotations in Extensible Application Markup Language (XAML). The
Valueof the grid line binds to aSlidernamedthreshold:XAML<charts:RadCartesianChart Grid.Row="2"> <charts:RadCartesianChart.BindingContext> <models:CategoricalViewModel /> </charts:RadCartesianChart.BindingContext> <charts:RadCartesianChart.Axes> <charts:CategoricalAxis x:Name="categories" /> <charts:NumericalAxis x:Name="values" Location="Left" Minimum="0" Maximum="100" /> </charts:RadCartesianChart.Axes> <charts:RadCartesianChart.Series> <charts:BarSeries HorizontalBinding="Category" VerticalBinding="Value" ItemsSource="{Binding Data}" /> </charts:RadCartesianChart.Series> <charts:RadCartesianChart.Annotations> <charts:ChartCategoricalPlotBandAnnotation x:Name="categoryBand" Axis="{x:Reference categories}" From="Feb" To="Apr" /> <charts:ChartPlotBandAnnotation Axis="{x:Reference categories}" From="Feb" To="Apr" Fill="{x:Null}" Stroke="OrangeRed" StrokeThickness="2" /> <charts:ChartPlotBandAnnotation Axis="{x:Reference values}" From="20" To="40" Fill="LightGreen" Opacity="0.3" StrokeThickness="0" /> <charts:ChartGridLineAnnotation Axis="{x:Reference values}" Value="{Binding Value, Source={x:Reference threshold}}" StrokeThickness="2" StrokeDashArray="4,2" /> </charts:RadCartesianChart.Annotations> </charts:RadCartesianChart> -
Add the
chartsnamespace:XAMLxmlns:charts="clr-namespace:Telerik.Maui.Controls.Charts;assembly=Telerik.Maui.Controls" -
Add the data model:
C#public class CategoricalData { public string Category { get; set; } public double Value { get; set; } } -
Add the
ViewModel:C#public class CategoricalViewModel { public ObservableCollection<CategoricalData> Data { get; } = new ObservableCollection<CategoricalData> { new CategoricalData { Category = "Jan", Value = 42 }, new CategoricalData { Category = "Feb", Value = 58 }, new CategoricalData { Category = "Mar", Value = 37 }, new CategoricalData { Category = "Apr", Value = 71 }, new CategoricalData { Category = "May", Value = 64 }, new CategoricalData { Category = "Jun", Value = 88 }, }; }
The following image shows the result. The band from Feb to Apr covers three complete categories, the green band marks the range from 20 to 40, and the dashed line marks the threshold value:
For a runnable example with the Cartesian Chart annotations, go to the SDKBrowser Demo Application and navigate to the Charts > Features category.