Creating a Map-Based Application in Blazor

Summarize with AI:
Any UI with a map in it is automatically cooler than any other UI. With the Telerik UI for Blazor’s Map component you can have an interactive, data-driven map to show off in minutes.
There is no doubt that a UI with a map is axiomatically cooler than a UI without one. With Progress Telerik UI for Blazor’s Map component, you can quickly create an interactive, data-driven, customizable map-based application that conveys key information (well, provided you have the latitude and longitude information for whatever you want to map).
Let me demonstrate that claim by creating an application that shows a map with a company’s warehouses, each with a cool bubble showing how much is in stock in each warehouse. Further, in this application, when a user clicks on a warehouse in the map, the application will display key information about the selected warehouse. And, just to add icing on the cake, I’ll let the user customize the display.
Setting up
I created the initial app using Visual Studio’s Blazor Server App template. Once the project initialized, I opened the Index.cshtml file and added the TelerikMap component to the page’s UI:
<TelerikMap Center="@Center">
    <MapLayers>

    </MapLayers>
</TelerikMap>
The Center attribute on the TelerikMap element establishes the geographical location the map is centered on. I’ve tied that to a field in my application (which I’ve cleverly named Center) and, thanks to a quick Google search, set that field to the latitude and longitude of my hometown of London, Ontario (that isn’t completely arbitrary choice: The resulting display shows all three of my fictional client’s North American warehouses).
With the TelerikMap component, location information must be held in an array of type double. That array must hold two values with the first value being the latitude and the second value being the longitude.
As a result, my Center field with the location information for London, Ontario, looks like this:
@code{
       public double[] Center { get; set; } = new double[] { 42.983612, -81.249725 };
A Telerik map actually consists of a set of MapLayer objects, each of which adds some data to the map.
For example, to get the initial display of a map, I add a MapLayer to type Tile, tied to the open-source OpenStreet service. The following boilerplate MapLayer gives me a base map (and includes a link to OpenStreet’s license page, as required by OpenStreet’s licensing agreement):
<MapLayers>
<MapLayer Type="@MapLayersType.Tile"
Attribution="© <a href='https://osm.org/copyright'>OpenStreetMap contributors</a>"
Subdomains="@(new string[] {"a", "b", "c"})"
UrlTemplate="https://#= subdomain #.tile.openstreetmap.org/#= zoom #/#= x #/#= y #.png"
>
</MapLayer>
</MapLayers>
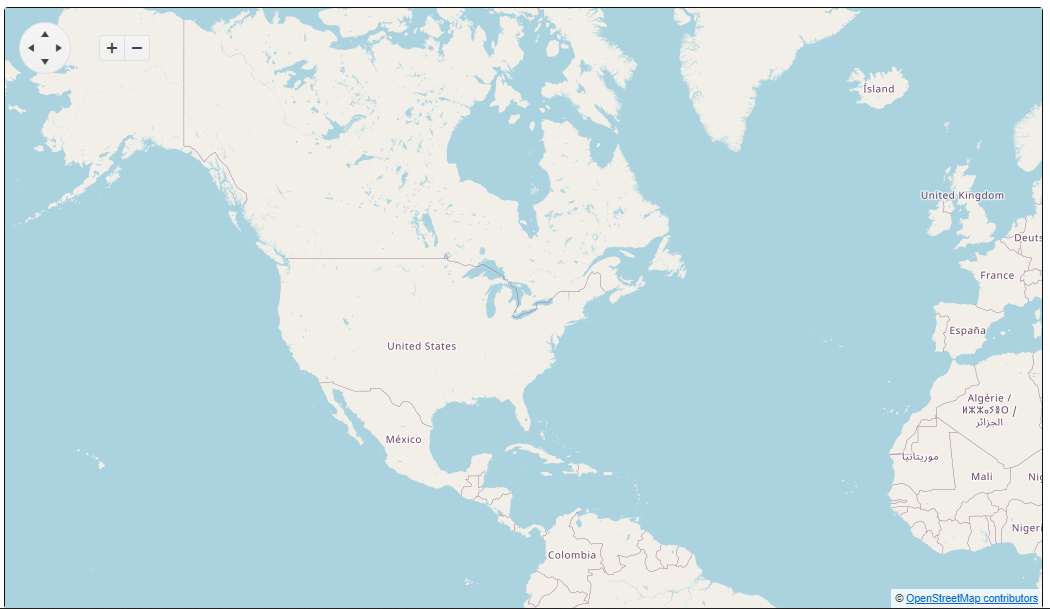
With just that in place, pressing F5 displays the initial map.
Getting Data
Now I’m ready to display some warehouse locations. First, of course, I need some data. For that, in the Index.cshtml’s OnInitializedAsync method, I retrieve a collection of Warehouse objects from (presumably) my client’s web service and store those objects in field I call warehouses:
IList<Warehouse> warehouses;
protected async override Task OnInitializedAsync()
{
   HttpClient httpClient = new HttpClient();
   HttpResponseMessage httpResponse = await httpClient.GetAsync("…");
   warehouses = await httpResponse.Content.ReadFromJsonAsync<IList<Warehouse>>();
}
My Warehouse object has an Address property that, in turn, holds an Address object which has several properties of its own: City, Street and (fortunately for me) a populated LatLong property with the location coordinates of the warehouse’s city.
Other information includes whether the warehouse accepts international shipments, the quantity on hand (QoH) and quantity sold:
public class Warehouse
{
   public int WarehouseId { get; set; }
   public int ProductId { get; set; }
   public string WarehouseName { get; set; }
   public bool International { get; set; }
   public Address Address { get; set; }
   public int Qoh { get; set; }
   public int Sold { get; set; }
}

public class Address
{
   public string Street { get; set; }
   public string City { get; set; }
   public string Country { get; set; }
   public double[] LatLong { get; set; }
}
Displaying Locations
Getting markers on my map for each warehouse just means adding a MapLayer to my Blazor map of type Marker and binding that MapLayer to my warehouses field. I also have to tell the MapLayer where to find the location information in each object.
Doing all that requires setting just three attributes on the MapLayer:
- Type: Set to MapLayersType.Marker to add a MapLayer that generates markers
- Data: Bound to collection of data to display (in my case, my warehouses field)
- LocationField: Set to the name of the property holding location information (in my case, the LatLong property in each warehouse’s Address property: Address.LatLong)
So, to display markers for all the warehouses in the warehouses list, I just add this MapLayer after my first Tile MapLayer:
    <MapLayer Type="@MapLayersType.Marker"
                  Data="@warehouses"
                  LocationField="Address.LatLong"
                  TitleField="Address.City"
    >
    </MapLayer>
</MapLayers>
Before I went on, I made a couple of tweaks: When I pressed F5 to look at my map, the map took up too much space on the page and started zoomed too far out. To fix that, I set the Height, Width and Zoom attributes in the TelerikMap element to get the display I wanted. There was some trial and error before I settled on these values:
<TelerikMap Center="@Center"
     	         Height="500px"
        Width="750px"
                       Zoom="4"
>
With those changes made, my markup (including both my Tile and Marker MapLayers) looked like this:
<TelerikMap Center="@Center"
     	         Height="500px"
                       Width="750px"
                       Zoom="4"
>
  <MapLayers>
          <MapLayer Type="@MapLayersType.Tile"
	….other attributes…
          >
         </MapLayer>

         <MapLayer Type="@MapLayersType.Marker"
                  Data="@warehouses"
                  LocationField="Address.LatLong"
                  TitleField="Address.City"
         >
        </MapLayer>

   </MapLayers>
</TelerikMap>
And the result looked like this:
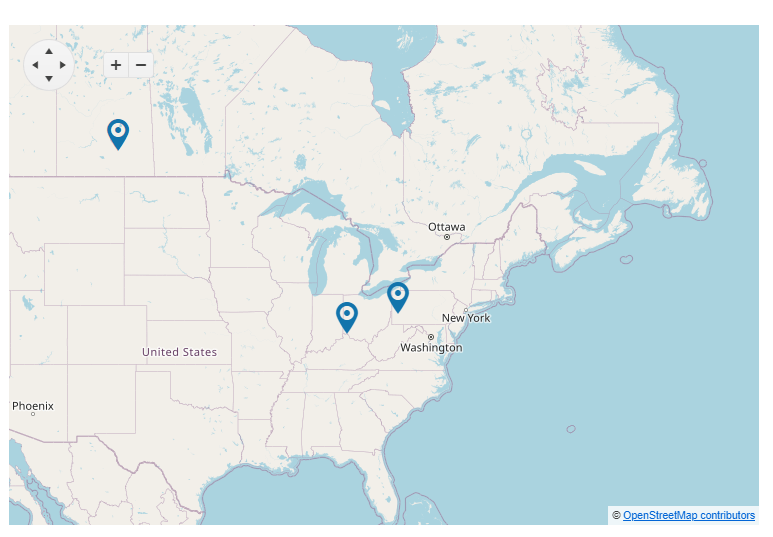
At this point, my map is starting to be genuinely useful (my client might, for example, wonder why they have two warehouses so close together in the eastern US). It would, of course, be even more useful if a marker displayed some information when the user clicks on it—the city name, for example.
I can add that functionality as tooltip on the marker by adding a Template element nested inside the MapLayer’s MapLayerMarkerSettings element. I can treat that template a little like part of a View: I can include code blocks, HTML and text, for example, which will be displayed when the user clicks on the marker.
In this example, I use a code block to retrieve the marker’s DataItem property (within the template, the current marker is represented by the pre-defined context pseudo-variable). The marker’s DataItem property holds the object tied to the marker (in my case, that’s one of my Warehouse objects). Once I’ve retrieved the DataItem (and cast it as a Warehouse object), I’ll display the warehouse’s city.
It all looks like this:
<MapLayer Type="@MapLayersType.Marker"
                     Data="@warehouses"
                     LocationField="Address.LatLong">
            <MapLayerMarkerSettings>
                  <MapLayerMarkerSettingsTooltip>
                    <Template>
                         @{
                                var wh = context.DataItem as Warehouse;
                              }
                          <div>@wh.Address.City</div>
                    </Template>
                </MapLayerMarkerSettingsTooltip>
            </MapLayerMarkerSettings>
</MapLayer>
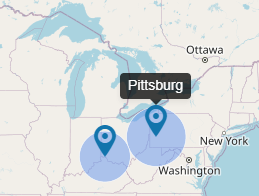
Now the user can confirm which warehouse they’re looking at just by clicking on the marker.
Enriching the Graphic Display
But, while it’s great to display some text to let users know where the warehouses are, it would be even better to add some key information as part of the graphic. To do that, I add another MapLayer to my Blazor Map—this time of type Bubble, and I have it show the quantity of goods on hand at each warehouse.
For a Bubble MapLayer, I need to set the MapLayer’s Type attribute to MapLayersType.Bubble and (as with my Marker MapLayer) set the LocationField to the property with the location information. But I also need to set the ValueField attribute to some numeric value that will control the size of the bubble drawn at that location.
In my case, I set the ValueField attribute to the Warehouse’s Qoh (Quantity on Hand) property. In addition, to get the bubble to display, I also need to use the MapLayerBubbleSettings which control the appearance of my bubbles. I pick a light blue for the bubble’s fill and white for the bubble’s outline, so my third MapLayer looks like this:
    <MapLayer Type="@MapLayersType.Bubble"
                  Data="@warehouses"
                  LocationField="Address.LatLong"
                  ValueField="Qoh">
            <MapLayerBubbleSettings>
                <MapLayerBubbleSettingsStyle>
                    <MapLayerBubbleSettingsStyleFill Color="cornflowerblue"/>
                    <MapLayerBubbleSettingsStyleStroke Color="white"/>
                </MapLayerBubbleSettingsStyle>
            </MapLayerBubbleSettings
     >
    </MapLayer>
</MapLayers>
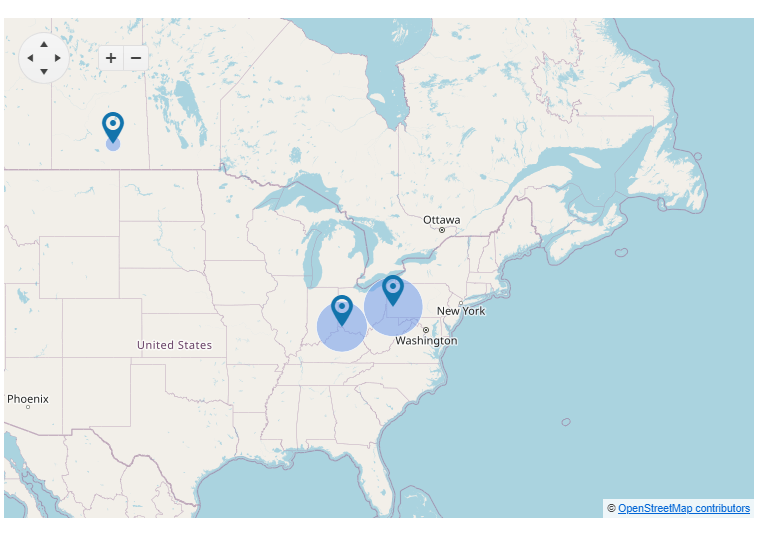
The result is not only, in my opinion at least, pretty good looking, it’s also genuinely useful: At a glance a user can see how which inventory is both at any warehouse and at all the warehouses in a region (i.e., Why do we have so much inventory in the eastern U.S. and so little in central Canada?).
Controlling the Map
Of course, no user interface is interesting without some interactivity. The Blazor TelerikMap has an OnClick event that fires any time a user clicks anywhere on the map.
I can tie that event to a method of my choice which accepts a MapClickEventArgs object. The MapClickEventArgs event object has Latitude and a Longtitude properties which I’ll use them to recenter the map.
My first change is to wire up the TelerikMap’s OnClick event to a method I call Recenter:
<TelerikMap Center="@Center"
                        Height="500px"
                        Width="750px"
                        Zoom="4"
                       OnClick="@AddWarehouse"
>
Next, I write the method to update the Center field that controls where my map is centered:
void Recenter(MapClickEventArgs args)
{
    Center = new double[] { args.Location.Latitude, args.Location.Longitude };
}
Now, when the user clicks on the map, the map will center itself around the region that the user has selected.
Displaying Data
The TelerikMap also supports a MarkerClickEvent that fires when the user clicks on a marker—this event passes a MapMarkerClickEventArgs object to the method the event is tied to.
This event object also has a DataItem property that holds the object tied to the marker. I could use this event to display information in another layer when the user clicks on a marker.
To implement that, I would first add tie the OnMarkerClick event on the TelerikMap element to a method called ShowWarehouse:
<TelerikMap Center="@Center"
                        Height="500px"
                        Width="750px"
                        Zoom="4"
                        OnClick="@Recenter"
                       OnMarkerClick="@ShowWarehouse"
>
Next, I would add some fields to my code area to hold key information about a warehouse:
@code
{
    string WarehouseName = string.Empty;
    int Qoh = 0;
    string City = string.Empty;
Finally, I would rewrite my ShowWarehouse method. In that method, I could extract the MapMarkerClickEventArgs’ DataItem property (casting it to be a Warehouse object) and set my fields from the Warehouse object’s properties:
void ShowWarehouse(MapMarkerClickEventArgs args)
{
    Warehouse wh = args.DataItem as Warehouse;
    WarehouseName = wh.WarehouseName;
    City = wh.Address.City;
    Qoh = wh.Qoh;
}
With that work done, I could access these fields and use them in one of map layers or as part of a ToolTip defined in a Template element.
Cleaning up the Display
Since I worry about information overload, I have to consider that the combination of both markers and bubbles might be more information than a user wants (or, alternatively, just consider sort of ugly). To handle that, I’ll give the user the ability to turn individual MapLayers on or off.
To make that happen, I add two checkboxes at the top of my page and tie them to fields I’ll set up in a moment:
<p>
    Show Bubbles:
    <TelerikCheckBox @bind-Value="@showBubbles" />
    <br />
    Show Markers:
    <TelerikCheckBox @bind-Value="@showMarkers" />
    <br />
</p>

<TelerikMap Center="@Center" …
I’ll then add the corresponding fields to my application:
@code
{
    bool showBubbles = true;
    bool showMarkers = true;
Finally, I’ll wrap my MapLayers inside if blocks that check the status of those two fields:
        @if (showMarkers)
        {
            <MapLayer Type="@MapLayersType.Marker"
               …
            </MapLayer>
        }

        @if (showBubbles)
        {
            <MapLayer Type="@MapLayersType.Bubble"
            …
            </MapLayer>
        }
Now the user can have their choice of layers to create a display that makes sense to them (though if they turn off markers they’ll lose the ability to click on a marker and see additional information about the selected warehouse).
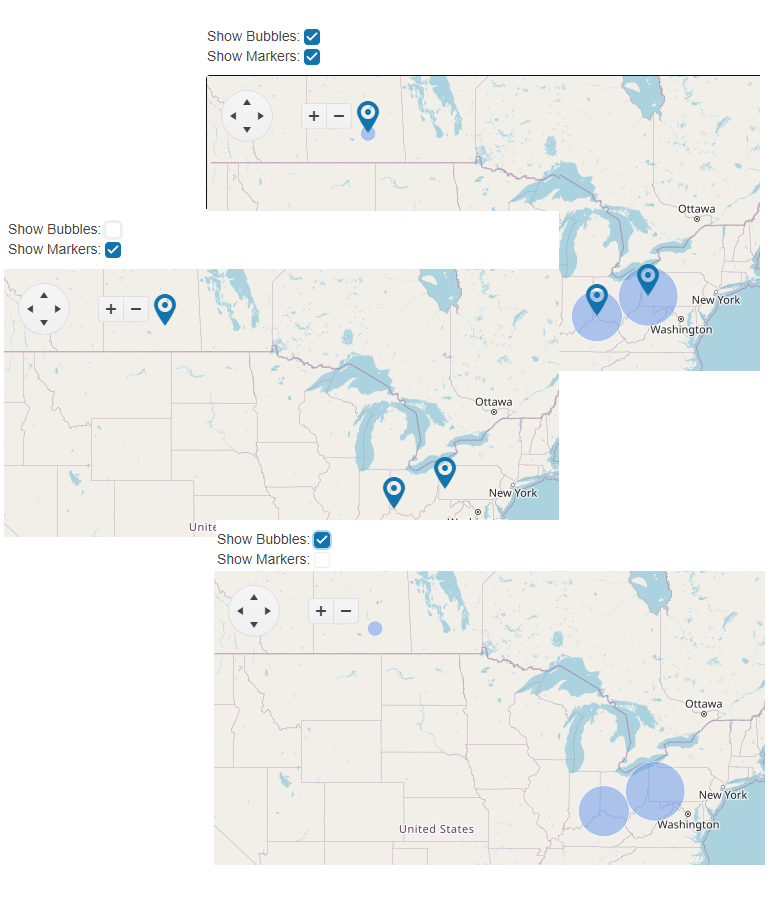
And that’s it! At this point I’ve not only got something that’s worth showing off to a friend but something potentially useful to my client (plus, it’s even customizable). That’s not bad.
Try Telerik UI for Blazor
Develop new Blazor apps and modernize legacy web projects in half the time with a high-performing Grid and 100+ truly native, easy-to-customize Blazor components to cover any requirement. Try it for free with our 30-day trial and enjoy our industry-leading support.

Peter Vogel
Peter Vogel is both the author of the Coding Azure series and the instructor for Coding Azure in the Classroom. Peter’s company provides full-stack development from UX design through object modeling to database design. Peter holds multiple certifications in Azure administration, architecture, development and security and is a Microsoft Certified Trainer.

