
How To Learn Expert Web Debugging Techniques That Get You to Done, Fast

Summarize with AI:
Get expert insight on the debugging techniques used by devs that you can add to your workflow.
When it comes to how you approach web debugging, there are valuable techniques you can take advantage of, yet first you need a guide to help you uncover them.
You’ve come to the right place, and your resident Telerik Ninja Robert Boedigheimer recorded a video titled, “Expert Network Debugging Techniques You Won’t Find Elsewhere.” Robert walks you through step by step how to utilize lesser-known features inside Fiddler Everywhere that you can put to use right away. Here is a transcription of the video to help you get started on a better network debugging journey.
What can you expect to uncover while performing network traces between the browser and the server?
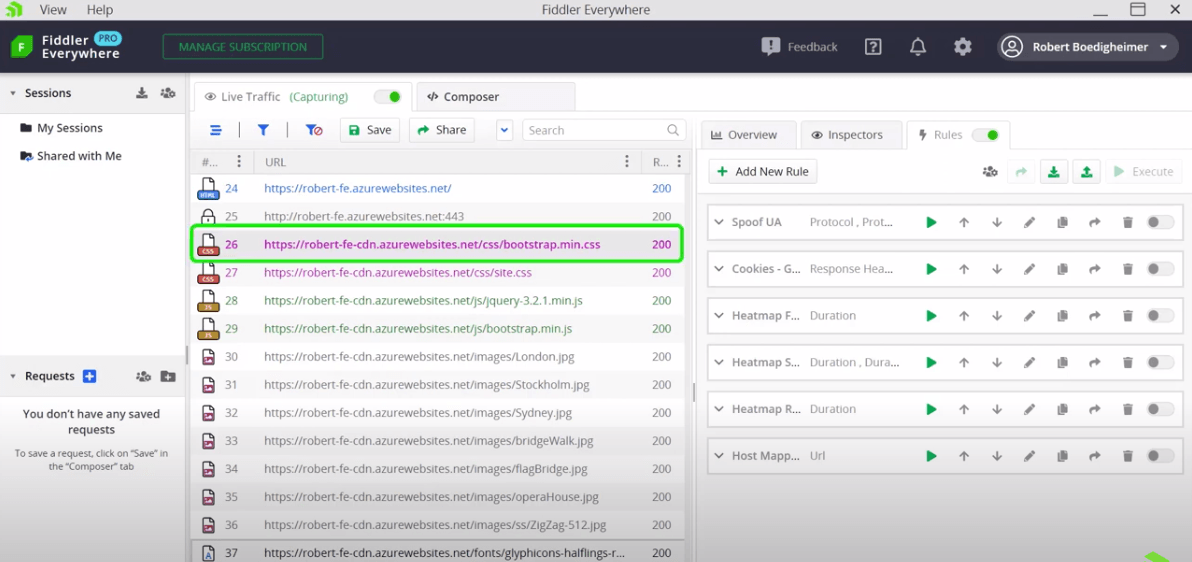
It’s common when we use Fiddler Everywhere and look at traces between the browser and the server that we might notice some random files that we’re not sure why they’re there. We’re often using third-party libraries and frameworks that might pull in additional files that we’re not familiar with. Fiddler Everywhere offers a nice way to trace from a particular file back to why it was requested.
In looking at a particular request in Fiddler Everywhere, we notice there’s a request at the bottom here for a font file, and I’m not sure exactly why that is being included on the page. What I can do is right-click and say select Parent Request. This will look back in these web sessions and identify why this is being used. By doing this, I can see that the font file was included because it was part of Bootstrap that I’m using for the design of the page.
How do you go about sharing a network trace with a colleague or a vendor?
I’ll often use Fiddler and get a trace between a browser and a server that I want to then share with someone else, another developer or a third-party vendor. Sometimes I want to put some additional information into that trace. What I’m going to see here is the jQuery request and I’m going to add a comment to it saying that I’d like to see this get upgraded. Then, simply right-click and say comment and hit OK. By default, that column might not appear in Fiddler. You can see an indicator that there is a comment here.
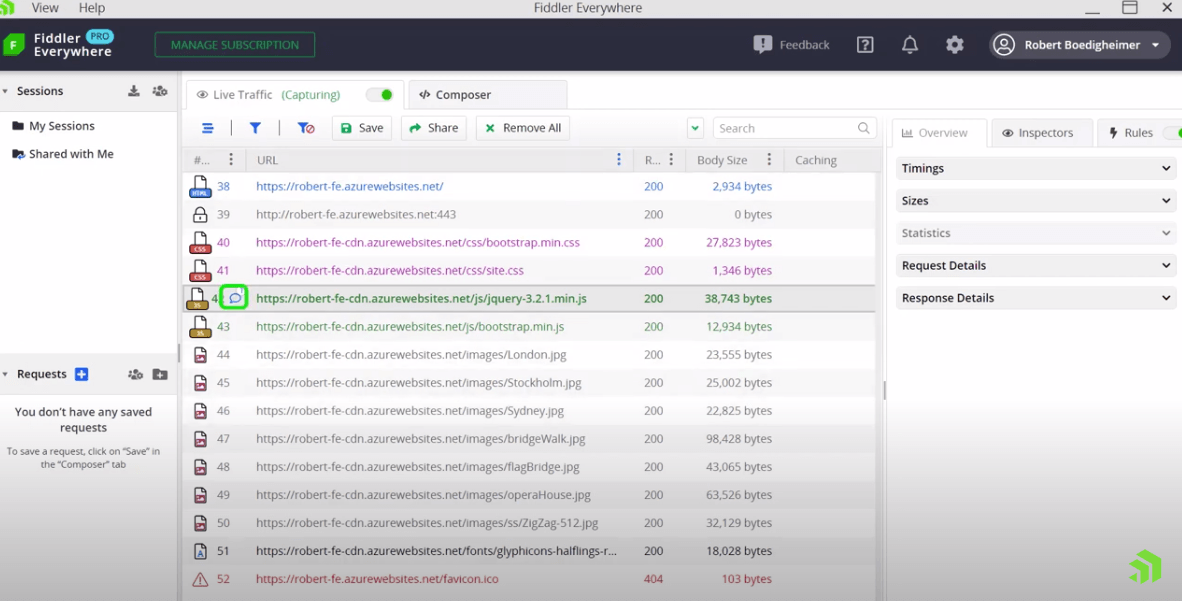
I can customize my columns and add comments. As I scroll to the right, we can see those specific comments. It’s great that it shows an indicator here that there is a specific comment on that specific session and then I can go see the details. Overall, it’s a nice way to communicate within the actual trace with other people.
How can you capture and inspect all network activity between your client and various hosts?
When I start Fiddler Everywhere, it’s notifying, in my case, for Windows to tell it if anyone proxies HTTP or HTTPS traffic, please go to the port that Fiddler Everywhere is running on. This is helpful because I can see all the things happening between my client and various hosts. Unfortunately, it’s distracting and can be frightening how much your machine is communicating with other hosts on the internet. Traditionally I’ve used the capturing functionality where I can capture the trace that I want and then toggle the Live Traffic capture off, so no other traffic is here.
Once I’ve identified what I want to see, I can stop new traffic from coming in. Unfortunately, there could be traffic from other services that I don’t want to see that get mixed in with these requests. To overcome this, I like to use the filter feature, and if we look here and open the filters, I typically will set up a filter based on the hostname. In this case, I want to start with Robert-FE for Fiddler Everywhere. These are the various hosts I want to see when I do this capture. This way I don’t have other requests from background services mixed in, which makes it harder to find what I’m looking for.
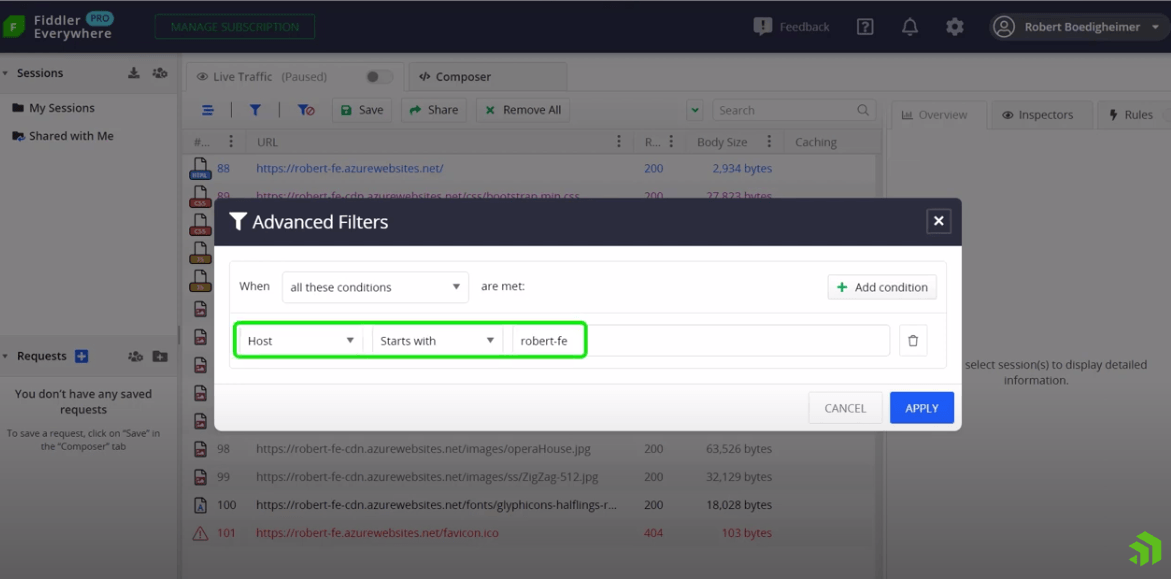
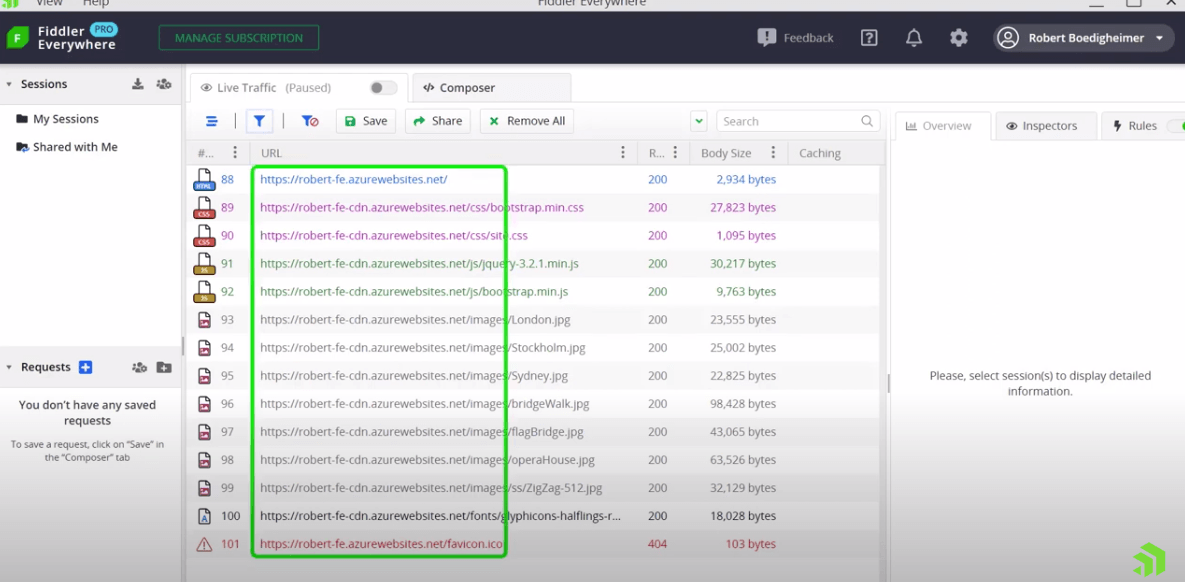
There are lots of filters that I can use. This is a very useful one, so you can home in on the specific host that you want to see during this trace. We can see by looking at the web sessions that they all indeed do start with that host. And we don’t have other requests in here that are making it difficult for us to understand specifically what we want to see. Another useful way to filter, if I need to use multiple browser instances potentially, and I only want to trace from a specific instance, I can look at the process that it’s running now.
In this case, I’ve got Edge open. In looking at the page, I can go back to customize my columns. Here, I’m going to add the process ID and now I can see the process ID of the instance I currently have open. If I go back to filters, I’m going to add a condition based on the process and for ease, I’m just going to say contains “7176.” I could type this specific process with the colon and such. I’m going to choose to do this for now so I can see those are still here.
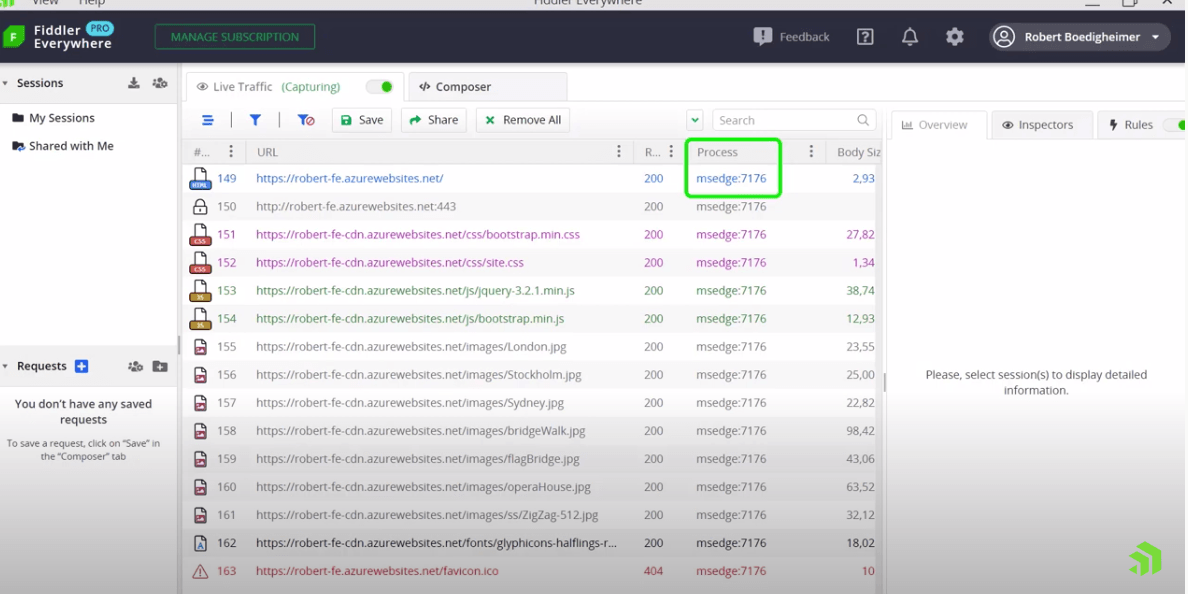
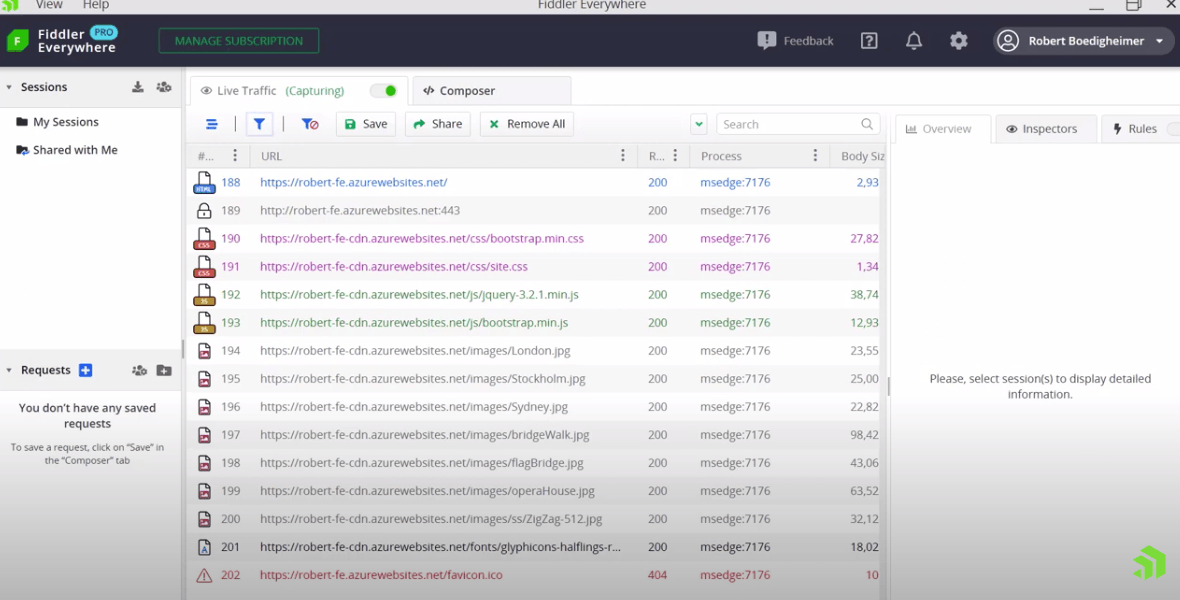
If I open another instance of a browser, we can see when we open Firefox and go to the same host and then go back to Fiddler Everywhere that it hasn’t changed because this filter is specifically for Edge and that process ID. Again, this is a nice way to isolate from background services or other browser instances where I may still be going to the same host, but I only see traffic for this specific process.
How can you communicate to the server that you are a different user agent?
In Fiddler Classic, there was a way to emulate different browsers so I could spoof the user agent sent from the client to the server. For the server, if it looks at specific user agents and customizes its content, I may want to simulate that from the client and see how the server responds. Obviously, the client is still going to be, in my case, the Edge browser, but I can communicate to the server that I’m a different user agent.
I’m going to do that today in Fiddler Everywhere using a Rule. You can see I have a spoof user agent rule. I’ll just open that and we can see. I’m looking if the protocol is either HTTPS or HTTP, I want to update the request header called User Agent and set it to this specific string.

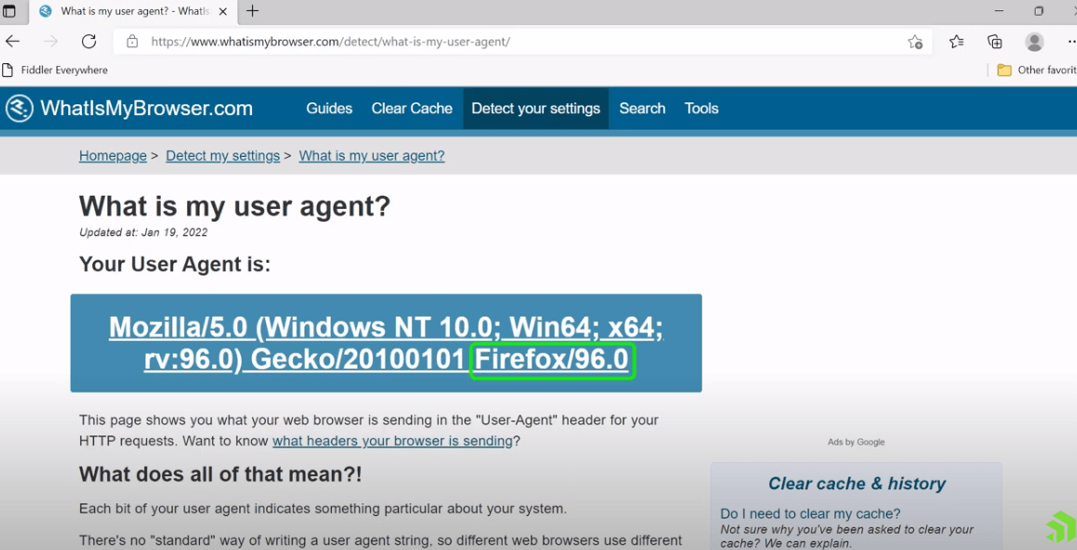
Now if we go to the end, you can see Firefox and the specific version. In this case, when I enable the Rule, the server will think that I’m a different client. Let’s save this and go to a site that reflects what user agent the server is seeing so we can determine that it sees Edge as my client. If I go back to Fiddler Everywhere, I can enable this Rule and go request that page again.
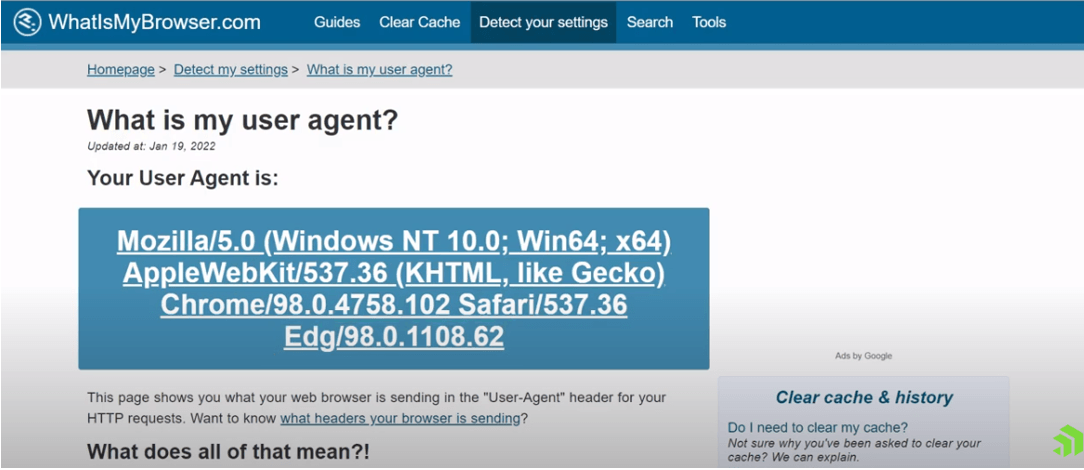
You can see from that server’s perspective that it looks like I’m running Firefox. So again, this is helpful if I need to impersonate a different user agent to my server. This way if the server behaves differently based on what user agent string it sees, I’ll see that different content when comes back to Fiddler.
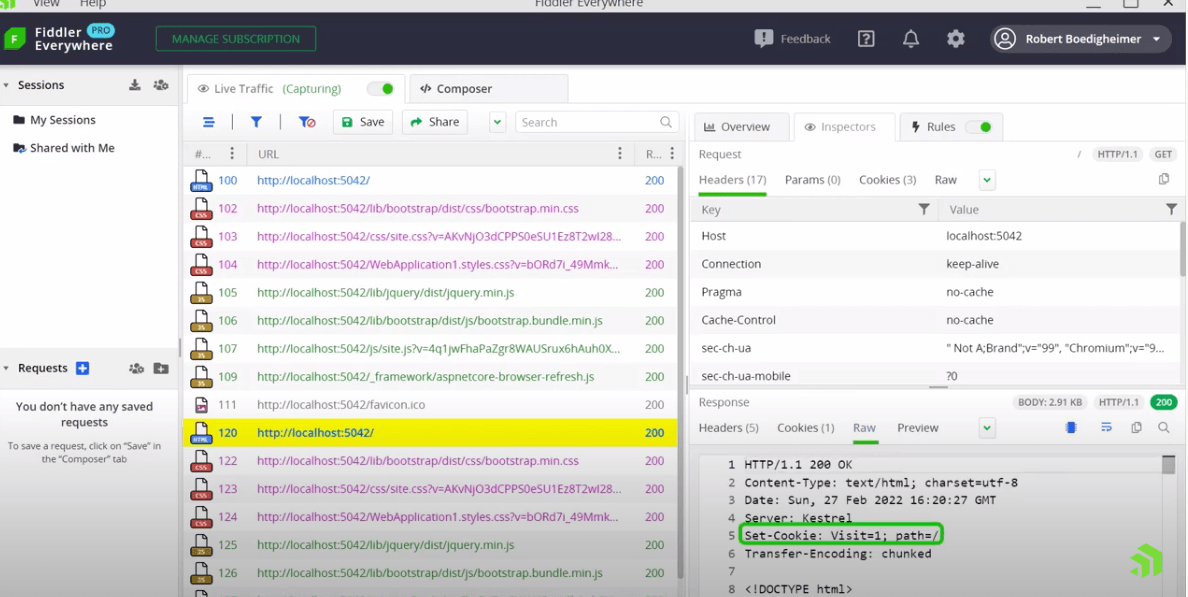
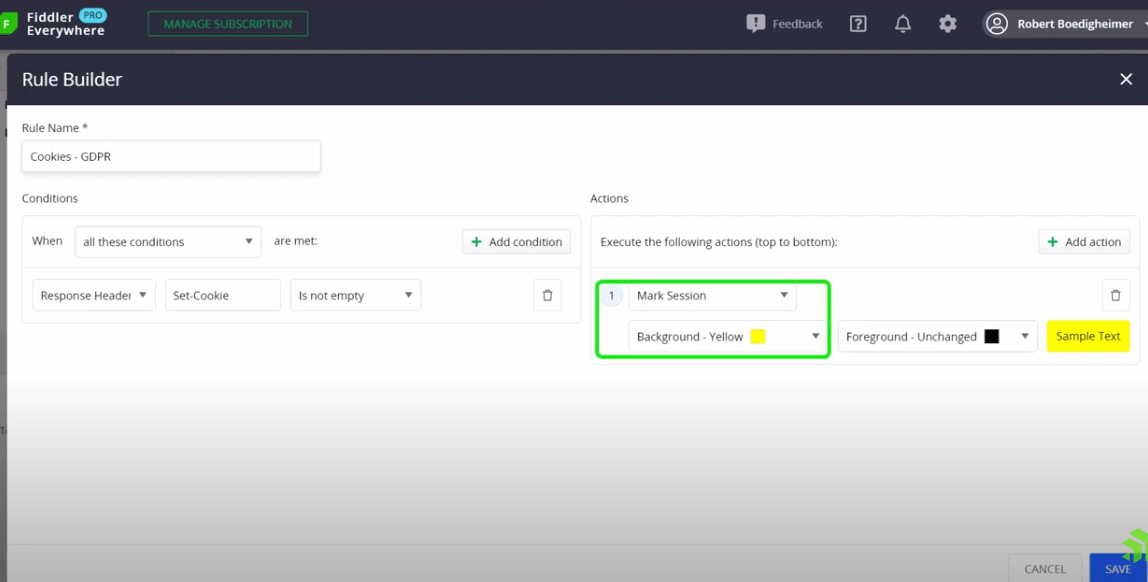
How do you know which HTTPS responses specifically set cookies?
If you are working to be compliant with GDPR or other specific regulations where you need to know all the responses of a particular site that sets cookies, this level of detail was found in Fiddler Classic in the Filters tab as a checkbox. We can do the same thing in Fiddler Everywhere using a Rule. Look at what the Rule looks like, and we’re looking for a response header that has a set cookie that’s not empty, and we opt to highlight the background of it in yellow. I created a very simple .NET 6 example using Razor pages where I set a cookie on this specific page.

The first time we visit the page we’ll have the Rule turned off. I hit CTRL + F5 to do a refresh, and we go back to Fiddler Everywhere where we can see the requests that were made. Now, if I turn this Rule on and we make the request again, when we go back to Fiddler Everywhere, we now see that that specific request is setting a cookie. In looking at the Inspectors and the raw response, we can see the cookie was indeed set. You get the drift, this is a very handy Rule if you need to know which responses specifically set cookies, this is a quick way to identify those specific sessions.
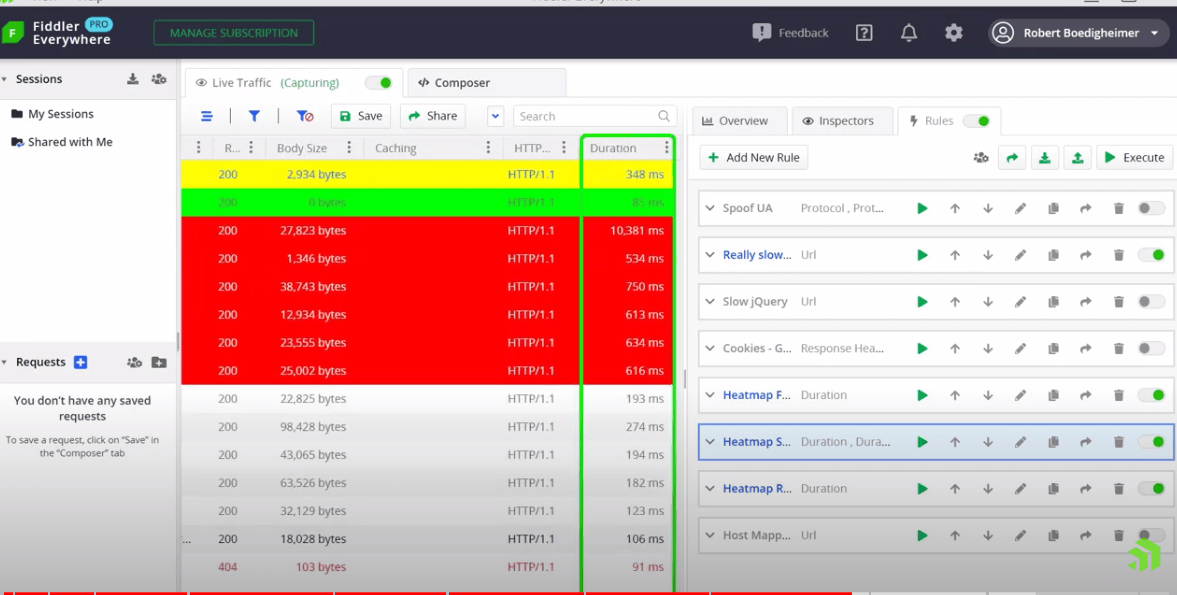
How do time heat maps help you analyze the performance of web page responses?
Another useful feature from Fiddler Classic was in the Filters tab. You may recall it offered you the ability to do what was called a time heat map. There were Rules in Fiddler Classic specifically around how long a response would take, and it would be highlighted using either green, yellow or red based on various thresholds, and how long a particular response took. It was nice because you could turn it on and immediately identify those responses that were taking longer than those thresholds so you could investigate why those were having issues.
For this example, I’ve intentionally made Bootstrap extremely slow, like 10 seconds, and I’ve made jQuery relatively slow using Rules that we saw in past videos. Now let’s look at some of these heat map Rules.
Here I made the thresholds the same as Fiddler Classic. If I look at the first one, and if it’s less than 50 milliseconds, it will have a background that is lime in color, which is a very fast response.
If we look at the next threshold, between 300 and 500 hundred milliseconds it’s marked in yellow for its relatively slow response.
Lastly, anything above 500 milliseconds is marked in red for the background which stresses that this is something that needs quick attention. If we make a request for the page and then go back to Fiddler Everywhere, we can see that it indicates specific responses on how fast they are. I added the duration as a custom column, so if go to the right, I can see the actual milliseconds it took. Based on these ranges, we can see the various indicators in the background about the performance of these pages.
How can you use Fidler Everywhere in conjunction with Chrome DevTools?
Another nice feature is the ability to import traces that were captured by Chrome DevTools into Fiddler Everywhere. I’m using Edge and I hit F12 and go to DevTools. From the Network tab, I hit CTRL + F5 and I can see the requests that are being made. I right-click and say, “Save all as hard with content.” We then save off this specific set of requests and responses.
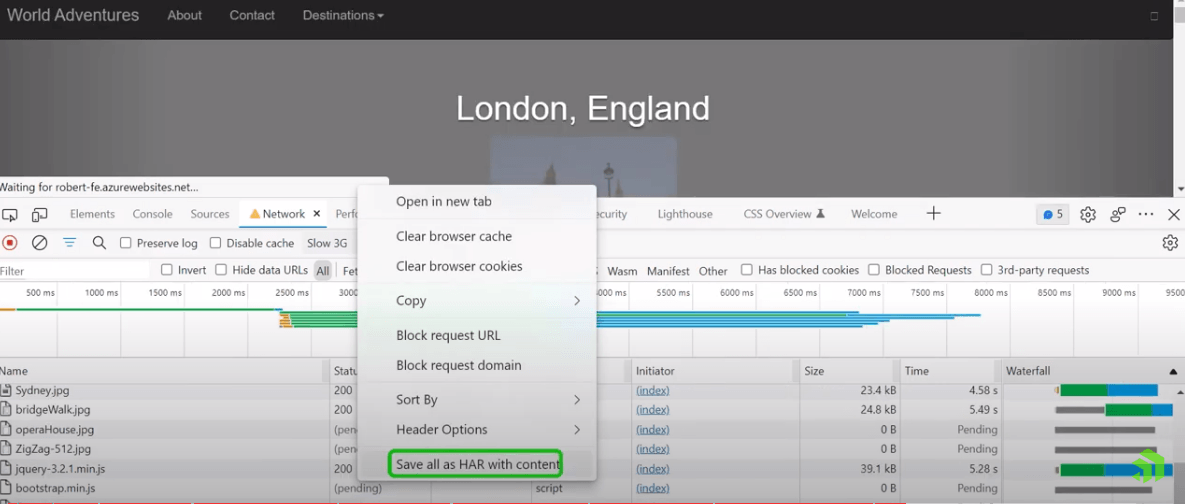
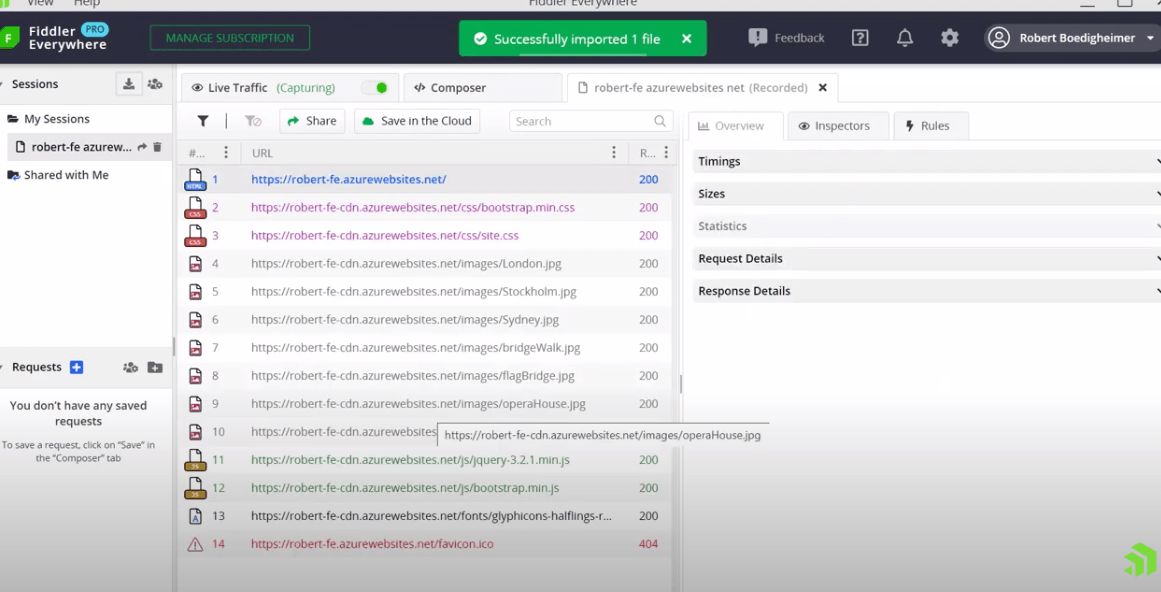
Now I can import the saved collection into Fiddler Everywhere for some troubleshooting. Back in Fiddler Everywhere, I go to the sessions that I want to import. After going to the downloads, I can open that hard file to see the request in Fiddler again.
This is especially helpful when you may be on someone else’s machine and wish to avoid having to install software for them. I can open their browser in DevTools, use the network, save the content and then import it. Now I can do my analysis inside Fiddler Everywhere’s UI where I’m used to the features and the things that I want to look for to accomplish this task.
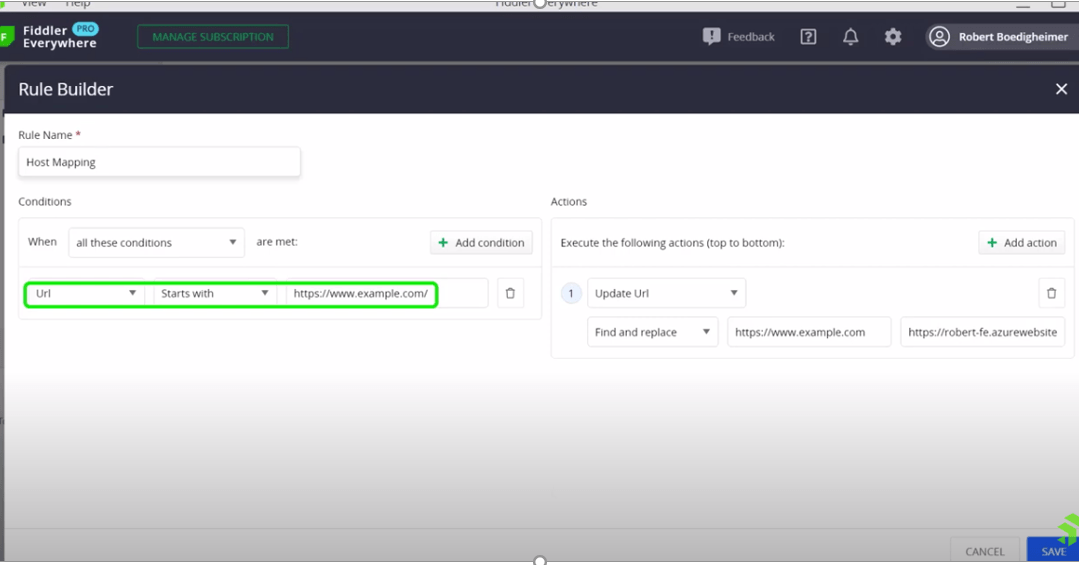
How do you get started with Host Mapping in Fiddler?
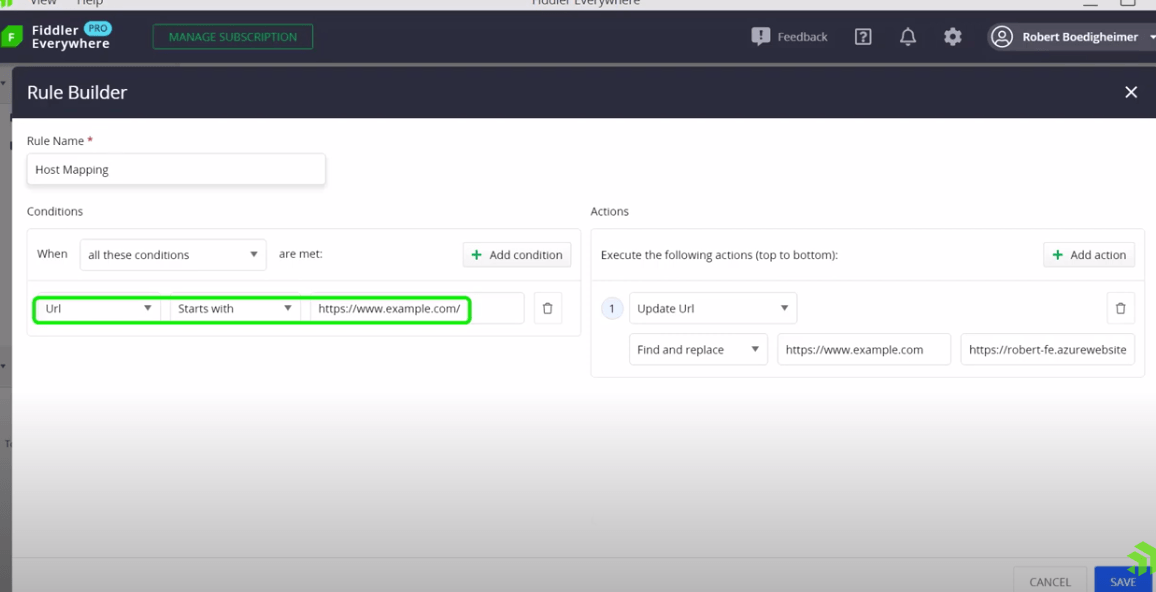
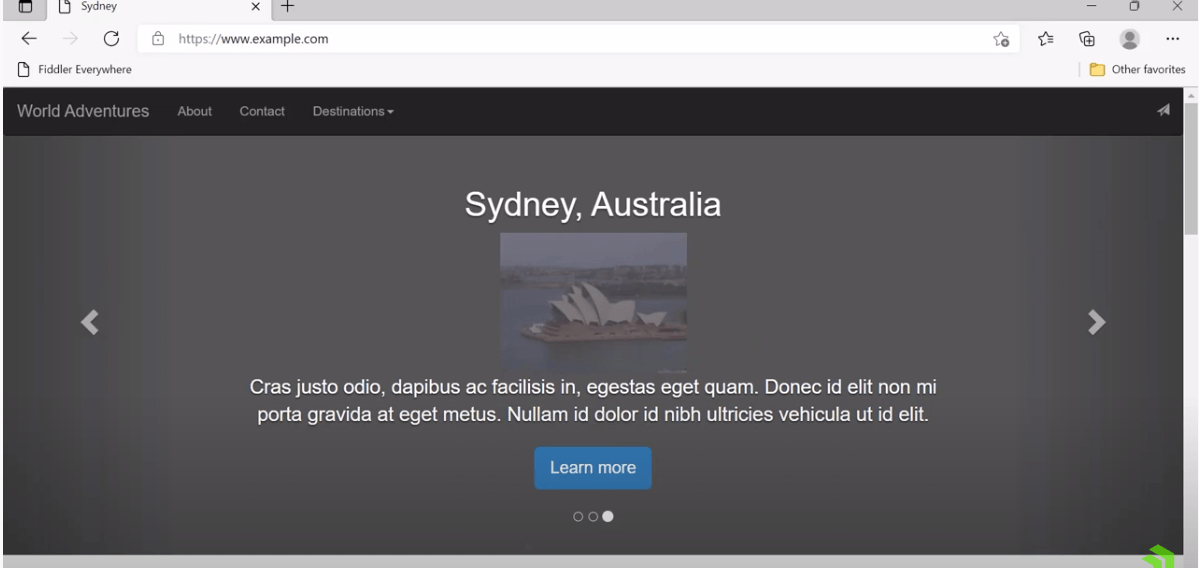
The last feature we’ll look at in this video is called Host Mapping in Fiddler Classic. But the idea was you have a specific host. In this case, I’m on example.com, but I want it to look like it’s on example.com from the client’s perspective. Yet I want to point it to a different website in the back end.
Let’s look at the Rule to accomplish this in Fiddler Everywhere. With this Rule, we will filter for sessions starting with https://www.example.com. We update the URL on the fly, and we point to the page we’ve been referring to throughout this video to see what happens when we enable the Rule.
Now I am back in the browser and hit CTRL + F5. It looks like the page we’ve been looking at because it’s running on that site, yet the browser thinks it’s still on example.com
How can you fake out your local machine to think it is running on the production site?
For a long time, I knew this feature existed in Classic but didn’t have a good use for it until one day our production website was using some third-party content that cared it was on our production version of the site.
I wanted to debug on my local machine, therefore I needed a way to make my local machine on the browser think it was running on the production site. This is where I could map it to a local site on my laptop so I could do troubleshooting. I added the production name and mapped it to my development server. Then I was able to use Visual Studio and do all the debugging on my machine and the third-party script would run because the browser thought it was running on my production site. So just a very handy feature at times to make it look like you’re running somewhere else to the browser but execute it in another location.
To catch the entire Fiddler Everywhere playlist, including four other videos hosted by Robert, visit . From improving your sites performance to troubleshooting remote devices, we have the “How To’s” and the “Know How” to put you on the right track. Debugging network traffic doesn’t have to be a tedious if you are equipped with the right tooling and techniques.

Eve Turzillo
Eve Turzillo is a Developer Advocate at Progress, with a passion for all things related to digital experience. For close to 20 years, Eve has been bridging the gap between technologies and community, starting with .NET and now with managed file transfer. Her experience spans various technical ecosystems, yet fostering community engagement and developing initiatives that align with both organizational goals and community needs has always been at the core of what she does.
Related Posts
Comments
All articles
Topics
Web MobileMobile
Desktop
Design
Productivity
People
