
Empowering Users: A Developer’s Guide to Interactivity with the Telerik HTML5 Report Viewer

Summarize with AI:
Telerik HTML5 Report Viewer will let your users interact with the report to get the data they want, find the part of the report that matters to them and share the report with others … but only if you make those options available to your users.
A good report converts data into information. A better report puts that data where it’s most useful to your users: Embedded inside the user’s application. A great report empowers those users by allowing them to interact with the report. The Progress Telerik Report Viewer lets you create those great reports.
Actually, Telerik provides a suite of Report Viewers that you can embed into applications. These Report Viewers support web applications created with ASP.NET/ASP.NET Core (Razor Pages, MVC, Blazor and Web Forms), Angular, React, Vue, and plain old HTML + JavaScript + CSS. On the desktop side, there are viewers for WPF, WinUI and Windows Forms (in multiple versions for all the different .NET and .NET Framework platforms). All the versions work in a similar way so, while this discussion focuses on the HTML5 Report Viewer, you’ll be able to translate these techniques to the other environments.
Before beginning: Assuming you use the default ReportTemplate.html file to control your report’s layout, most of the options that a user needs to interact with your report (e.g., page forward/back, search, export to other formats) are already turned on.
But to create that great report that integrates with your user’s application and fully empowers your users, you have to take advantage of four additional features when designing your report:
- Parameters
- Document maps
- Refreshed data
Integrating a Report into an Application
You can get your report to integrate with the current state of the application that it’s embedded in by adding parameters to your report (you can either add parameters when you build the report in the Report Designer or add parameters from code when you display the report at run time). Once you’ve added a parameter to your report, you can set that parameter to control what’s displayed in the report (probably by filtering the data in your report) using a value drawn from the application.
With the HTML5 Report Viewer, setting a parameter’s value in your report can be as simple as using a little jQuery as part of the report’s reportSource settings to retrieve a value from another element on the page. These settings, for example,
set a parameter called CategoryName by retrieving a value from an element with its id attribute set to categoryNameInput:
reportSource: {
  report: "Samples/ProductsByCategory",
  parameters: { CategoryName: $('#categoryNameInput').val() }
},
As your user makes changes in their application, you’ll want your report to stay in sync with the application’s current data. That means you’ll want to wire some code up to an event in the application’s UI to keep updating that
parameter. You’ll need some variation on this sample code that resets the report’s CategoryName parameter to the current value in the categoryNameInput element:
function UpdateParameters() {
  var viewer = $("#reportViewer1").data("telerik_ReportViewer");
  viewer.reportSource({
    report: "Samples/ProductsByCategory",
    parameters: { CategoryName: $('#categoryNameInput').val() }
  });
}
Empowering Your User
But here’s the thing: The data you display may not always be the data that the user needs. The user, for example, may not want to look at just the inventory levels for the product the application is displaying—your user may want to check the inventory levels on a product related to the product being displayed. You can go one step further than just integrating your report into the application by letting your user change parameter values at run time to get the report they need.
On the surface, allowing users to view and change parameters is simple: When creating the parameter, just set the parameter’s Visible property to true in the Report Designer (or set the parameter’s IsVisible property to true when creating the parameter from code at run time). When the user clicks on the filter icon in the Report Viewer’s menu bar, a panel displaying all the parameters marked as visible is displayed, showing the parameters’ current value.
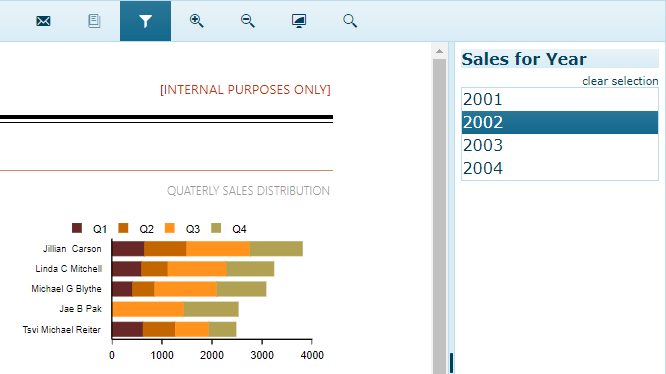
However, you’ll also want to ensure that the user always gets a report by exercising some control over what the user enters as a parameter value. Getting that control can also be easy just by setting the properties on a parameter in the Report Designer: You can provide a default value for the parameter, supply a list of values that the user can select from (either hard-coded or drawn from the database), and prevent the user from entering blank or NULL entries.
You can also have the report auto-refresh when the user changes a value in the report’s parameter panel (and, if you don’t turn on the auto-refresh option, the Report Viewer displays a preview button the user can click to see the revised report after making their changes).
However, if those options don’t give you enough control, you can create a custom editing component for any parameter.
Enabling Email
Information is often only useful it is shared. By default, users can export their data in a variety of formats … but, with your help, they can also email a report as an attachment in any of those formats if you enable email support.
If you’re using Report Server, enabling email is a two-step process:
Navigate to your server’s instance of the Telerik Report Server (probably at port 83 on your server) and enter the information to connect the report server to your SMTP server. This lets you centralize your email server settings in one place.
In your report, in the
sendEmailoption, set its enabled property to true. Now, when the user clicks on the Email icon in the Report Viewer menu bar, a form will pop open that lets the user create an email with the report attached (the user can pick the export format for the report).
sendEmail: { enabled: true },
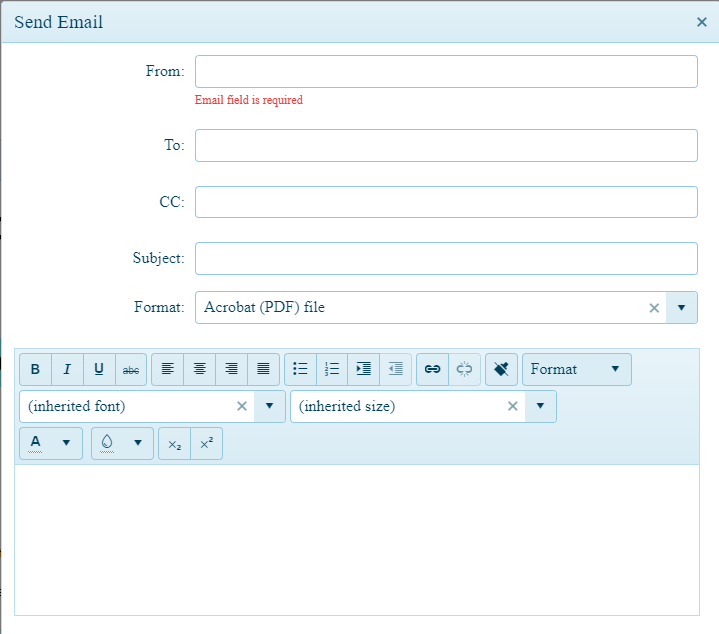
In addition to setting the sendEmail’s enabled property, you can preload the email form by setting additional properties (e.g., to, from, subject, etc.) on sendEmail. This example sets a default subject for any
email that the user chooses to send:
sendEmail: {
  enabled: true,
  subject: "Product by Category Report"
},
You can also skip configuring your SMTP settings in Report Server (or override those settings on a report-by-report basis) by wiring up your own server-side code to the Report Viewer’s SendMailMessage event.
Two More Things
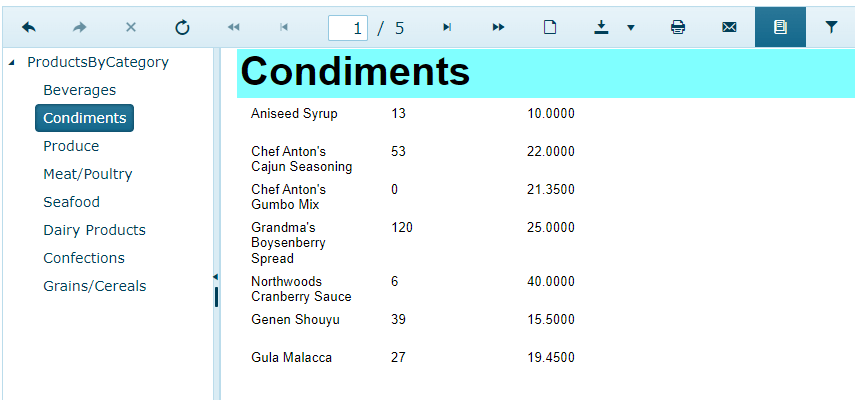
You can also help the user find the data they want by generating a document map that lets users navigate to the section (or even the line) they want. All you have to do is set the TocText property in any component
of your report to some expression. For example, setting the TocText property of a group header to a field name from the report’s data source (e.g., = Fields.CategoryName)
creates a document map that users can use to find the category of products they want.
Your users may also want to get the latest version of your report’s data. You can enable the Report Viewer’s refresh icon just by setting the ready property in your report’s settings with to a JavaScript function with a single line of code:
ready: function () {
  this.refreshReport();
},
A great report empowers your users to make better decisions by doing two things: integrating with the applications where users need the information and then providing the tools users need to work with that information. With the Telerik Report Designer and Report Viewers, you can deliver all of that.
Ready to Take Advantage of Embedded Reporting?
Progress Telerik Reporting provides all the tools you need to embed the rich, interactive reports your users need to order to analyze and understand their data right into your users' applications (including letting your users export the results into more than 15 formats, either to distribute or integrate with other analysis tools). Telerik Reporting then lets you go further and empower your users with a fully functional Web Report Designer to create the reports they want without ever leaving the applications where they'll use their reports.
You can leverage these easy-to-use tools both in any web and desktop applications: Blazor, ASP.NET Core, ASP.NET MVC, ASP.NET AJAX, WinForms, WPF, Angular, HTML5/JS, React, Vue.
If you still have not tried it, you can start a free trial to take a closer look. A renowned support service and an array of resources will help you along the way. Support is free during your trial. Telerik Reporting is also available in DevCraft bundles.

Peter Vogel
Peter Vogel is both the author of the Coding Azure series and the instructor for Coding Azure in the Classroom. Peter’s company provides full-stack development from UX design through object modeling to database design. Peter holds multiple certifications in Azure administration, architecture, development and security and is a Microsoft Certified Trainer.
Related Posts
Comments
All articles
Topics
Web MobileMobile
Desktop
Design
Productivity
People
