Embedded Reporting (Part 2): Enable Your Business Users to Create, Edit, View Reports on Their Own

Summarize with AI:
Discover the top embedded reporting tools you need to empower your end users to create, edit, style, view and export reports on their own. Learn more now!
Data isn’t helpful to your users—they need that data turned into information. We call that process “reporting” and it’s obviously a good thing (so much of a good thing that many IT departments can’t keep up with the demand).
But information is most useful to users when it’s not segregated off into a “reporting system.” Information is most useful when it’s delivered to the user at the moment they need it, delivered as part of the applications that your users interact with every day. Delivering information where the user needs it (“embedded reporting”), in order to be effective, depends on three things: integration, interaction and empowerment.
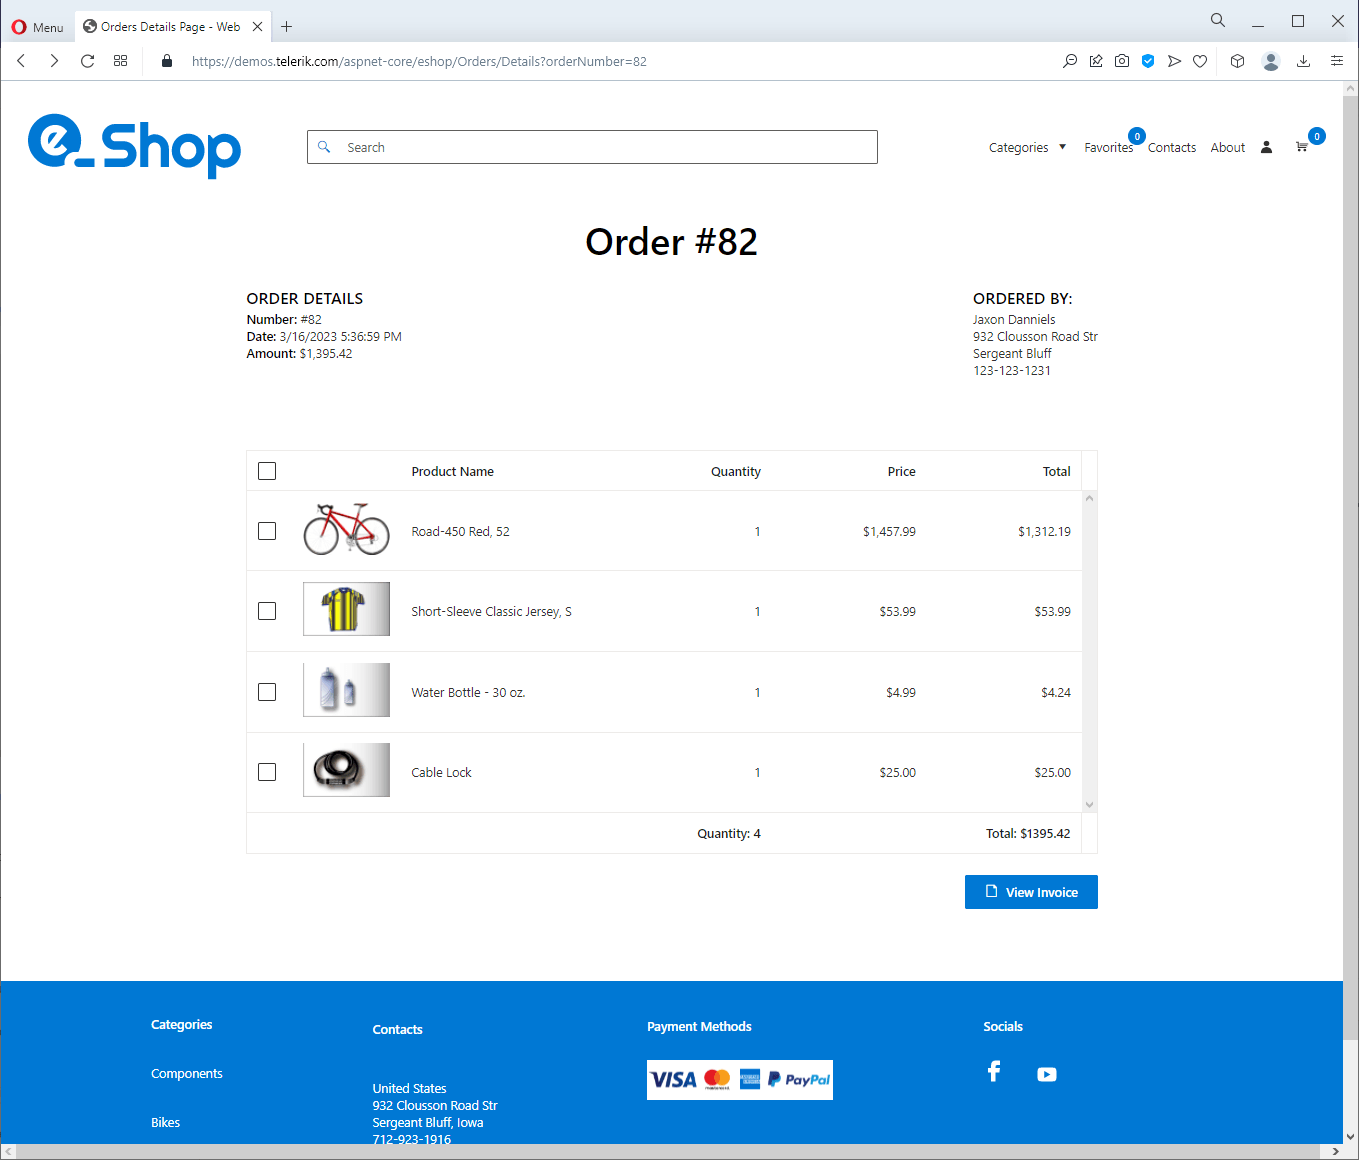
Image captured from a demo application representing an e-shop for bikes and biking accessories.
Integrating Information with Embedded Reporting
A great embedded reporting toolset lets your users view the information they need in almost any application. This, obviously, includes web-based applications built with client-side toolsets (plain old JavaScript, client-side frameworks like Angular/Vue/React, even sophisticated client-side tools like Blazor).
Progress Telerik Reporting’s report viewers not only integrate with all those toolsets—they also integrate with server-side development done with any version of the ASP.NET toolsets (from the latest version of ASP.NET Core all the way back to ASP.NET WebForms).
Telerik report viewers also integrate with any desktop application built with Microsoft tools beginning with trusted platforms like WinForms and carrying on through WPF and WinUI and even Microsoft’s latest client-side technology, Blazor.
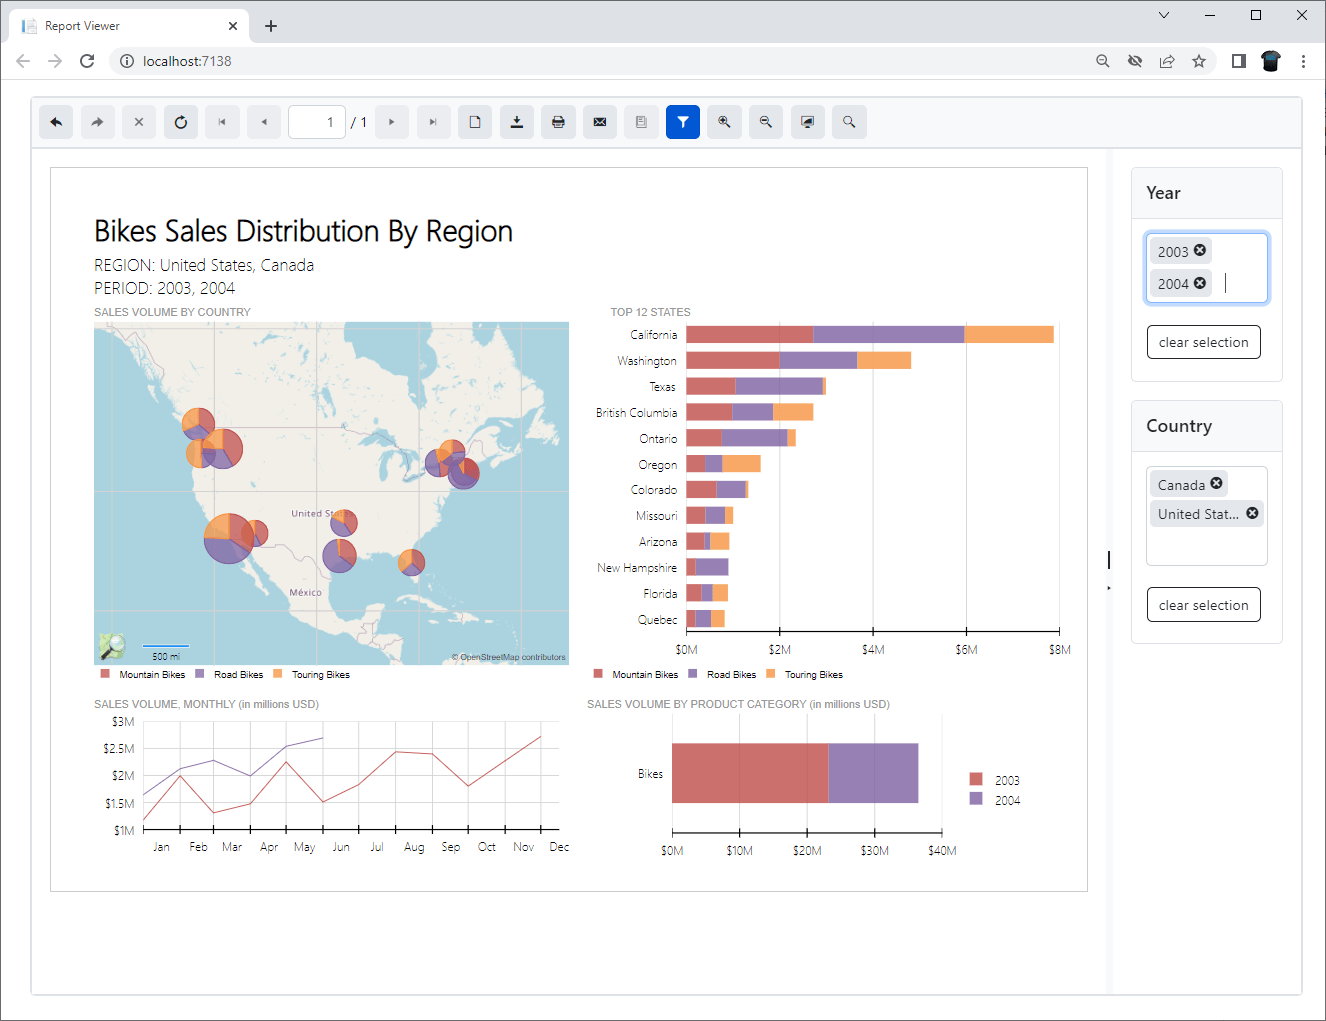
But to keep up with the demand for embedded reports, integrating report viewers with applications has to be simple for the developer. In development environments that support drag-and-drop, a developer should be able to just drop a viewer into a user interface and then set a few properties.
Telerik report viewers not only support that paradigm but, where developers are working in an environment that doesn’t support drag-and-drop, a developer can add a report viewer to an application using Telerik Item Template wizards (or by writing one or two lines of code).
User Interaction with Embedded Reporting
To be useful, an embedded report viewer has to interact with the user so that the user can get to the information they need instantly (and dismiss it when they don’t). But an embedded report also has to interact with the application that it’s part of in order to deliver relevant, actionable information to the user.
Progress Telerik’s decades of building user interface tools mean that its viewers, regardless of the platform, let users both access the information when they want it and dismiss it when they don’t. That integration with the user includes out-of-the-box accessibility support for users who normally must cope with usability challenges while working with data visualization tools.
But the report is useless to the user unless the report is also relevant to what the user is doing with the application right now. A “big picture sales report” is no good to a user who’s trying to complete a sale for customer A123 in the next five minutes. Telerik reports support integrating with the data the user is interacting with right now to provide the focused information the user requires.
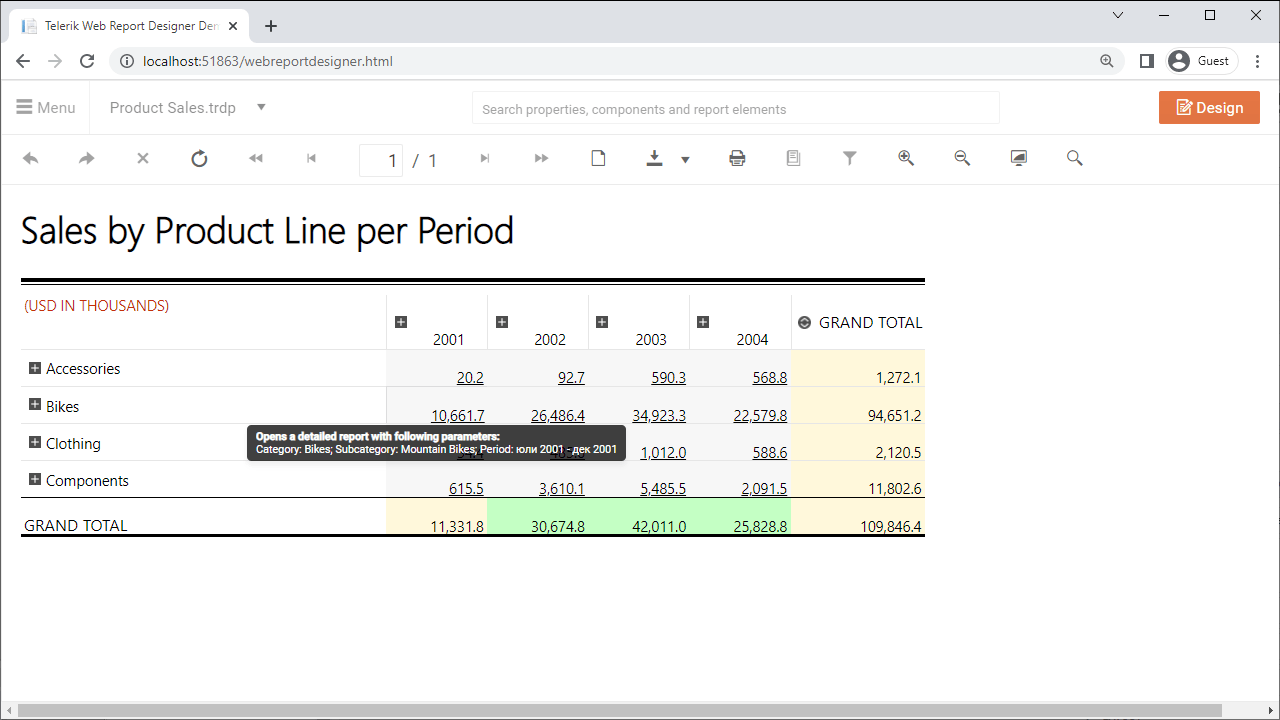
That’s not always enough, though. Once a report is displayed, users may need to interact with the report to change parameters to support additional analysis, to explore “what if” scenarios … or even to get to that “big picture” view. Telerik report viewers not only support delivering the report that the user needs but also allow the user to make “on the fly” changes to those reports. And, if the user needs to drill down to the underlying data in order to make good decisions, Telerik reports let the user do that, too. Users can always get to the information they need.
However, once you let users access information as they need it, you have to start thinking about both security and privacy. Progress Telerik’s interaction with data sources ensures that users can see all the information they’re allowed to access in order to make good decisions.
Equally importantly, Telerik tools (including Telerik Report Server) also let you ensure that users can’t access information that they shouldn’t have by leveraging the authentication and authorization policies you already have in place.
User Empowerment with Embedded Reporting
This all assumes that there is a) a report available for the user to view and b) that report delivers real value to that user. However, IT departments often don’t have time to develop the reports that users need. And, even when the IT department can find the time, often (and with the best intentions in the world) the resulting report isn’t what the user needs.
Self-serve reporting tools address both of those needs by enabling users to create the reports they need. After all, the person who knows best what the user needs embedded in the application is the user who interacts with that application. But users shouldn’t have to go off to the “reporting system” to create those reports.
The embeddable Telerik Web Report Designer lets users create the report they need without leaving the application where they’ll use it. Adding Telerik report designer to an application’s UI is as straightforward as adding a report viewer. With Telerik Web Report Designer, users can create a report from scratch or download an existing report definition to use as a start point for creating the report they need.
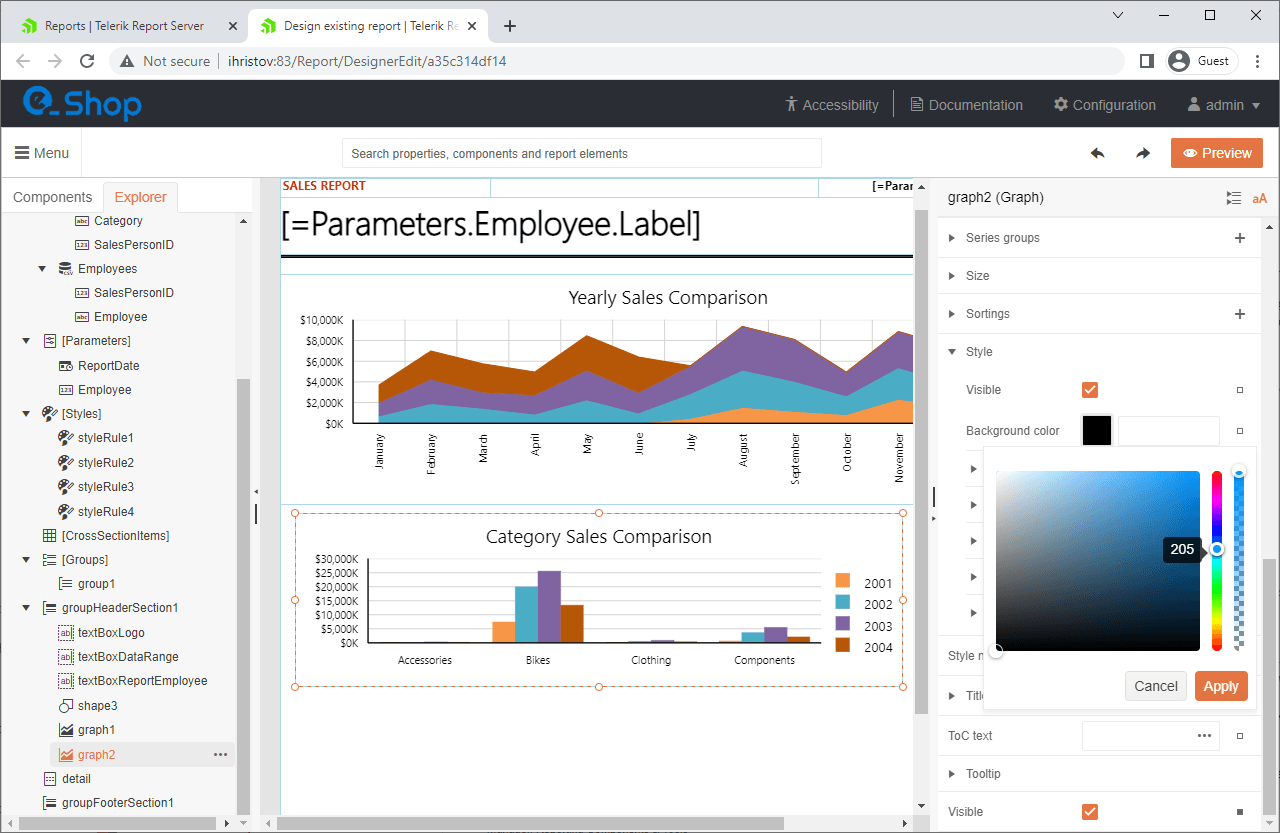
Integration, interaction and empowerment describe the critical functionality required by an effective embedded reporting solution. The embedded reporting tools from Progress Telerik support all three, enabling your users to get to the information they need to make better decisions and do it without having to leave the applications that drive your business.
Ready to Take Advantage of Embedded Reporting?
Progress Telerik Reporting provides all the tools you need to embed the rich, interactive reports your users need in order to analyze and understand their data right into your users’ applications (including letting your users export the results into more than 15 formats, either to distribute or integrate with other analysis tools). Telerik Reporting then lets you go further and empower your users to create the reports they want without ever leaving the applications where they’ll use their reports.
You can leverage these easy-to-use tools in both any client-side Web application environment (HTML5/JS, Angular, React, Vue, or Blazor) and any .NET application (Web or desktop: ASP.NET Core, ASP.NET MVC, ASP.NET AJAX, WinForms and UWP).
If you still have not tried it, you can start a free trial to take a closer look. You’ll find renowned support service and loads of resources that will help you along the way.
Related Blog Posts

Peter Vogel
Peter Vogel is both the author of the Coding Azure series and the instructor for Coding Azure in the Classroom. Peter’s company provides full-stack development from UX design through object modeling to database design. Peter holds multiple certifications in Azure administration, architecture, development and security and is a Microsoft Certified Trainer.

