Embed Reporting Everywhere

Summarize with AI:
Use Telerik Reporting with the latest technologies. Build beautiful reports with the report designers and display them in .NET Core, Blazor, React and many other projects.
Blazor, ASP.NET Core, Angular, WPF, WinUI, React, Vue are only some of the technologies that Telerik Reporting can be embedded in. Because we always strive to be up-to-date with the newest innovations, we have also added support for .NET 5 and the latest preview of .NET 6 during the past months. Have you imagined that one product can be integrated in so many kinds of projects? In this blog post, we will show you how this is completely possible and why reporting is a key player in our world.
Importance of Reporting
Let’s start with the importance of reporting in general. A must-have for each successful business or organization is having a reporting tool that generates KPI tracking and their changes in time and any document part of the business flow.
An embeddable reporting solution would empower you, as a developer, to add valuable functionality for your client businesses. Right into your app. They would be able not only to visualize and keep track of past and present data, but it also to help them make effective business decisions. What is more, once they make a certain business decision, they would be able to track and assess if it was right or wrong.
As an example, let’s dig deeper into an organization and take its sales department. From one side, how would the company know how each sales representative is performing without a suitable report? And how would a sales professional convince a client in the performance of the offered product without a data report demonstrating it? Data is king.
And here comes Telerik Reporting—Progress’ powerful reporting solution that can be embedded and used in more than 10 technologies. It is one of the best advantages that you can have against your business competitors and the tool that will always be by your side.
Telerik Reporting will save you a large amount of development time by providing a wide variety of ready-to-use components that can be added to the report. You can build a report from scratch in minutes by using the drag-and-drop functionality of the items.
Stay tuned to find out more about our report designers, viewers and how you can combine Telerik Reporting with other Progress components.
Report Designers
We provide not one, not two but three super powerful report designers that help you with report generation. All of them include features such as a WYSIWYG report design surface, enhanced support for expressions, and wizards for creating graphs, maps, crosstabs, tables, etc.
Let’s install Telerik Reporting and take a close look at each report designer.
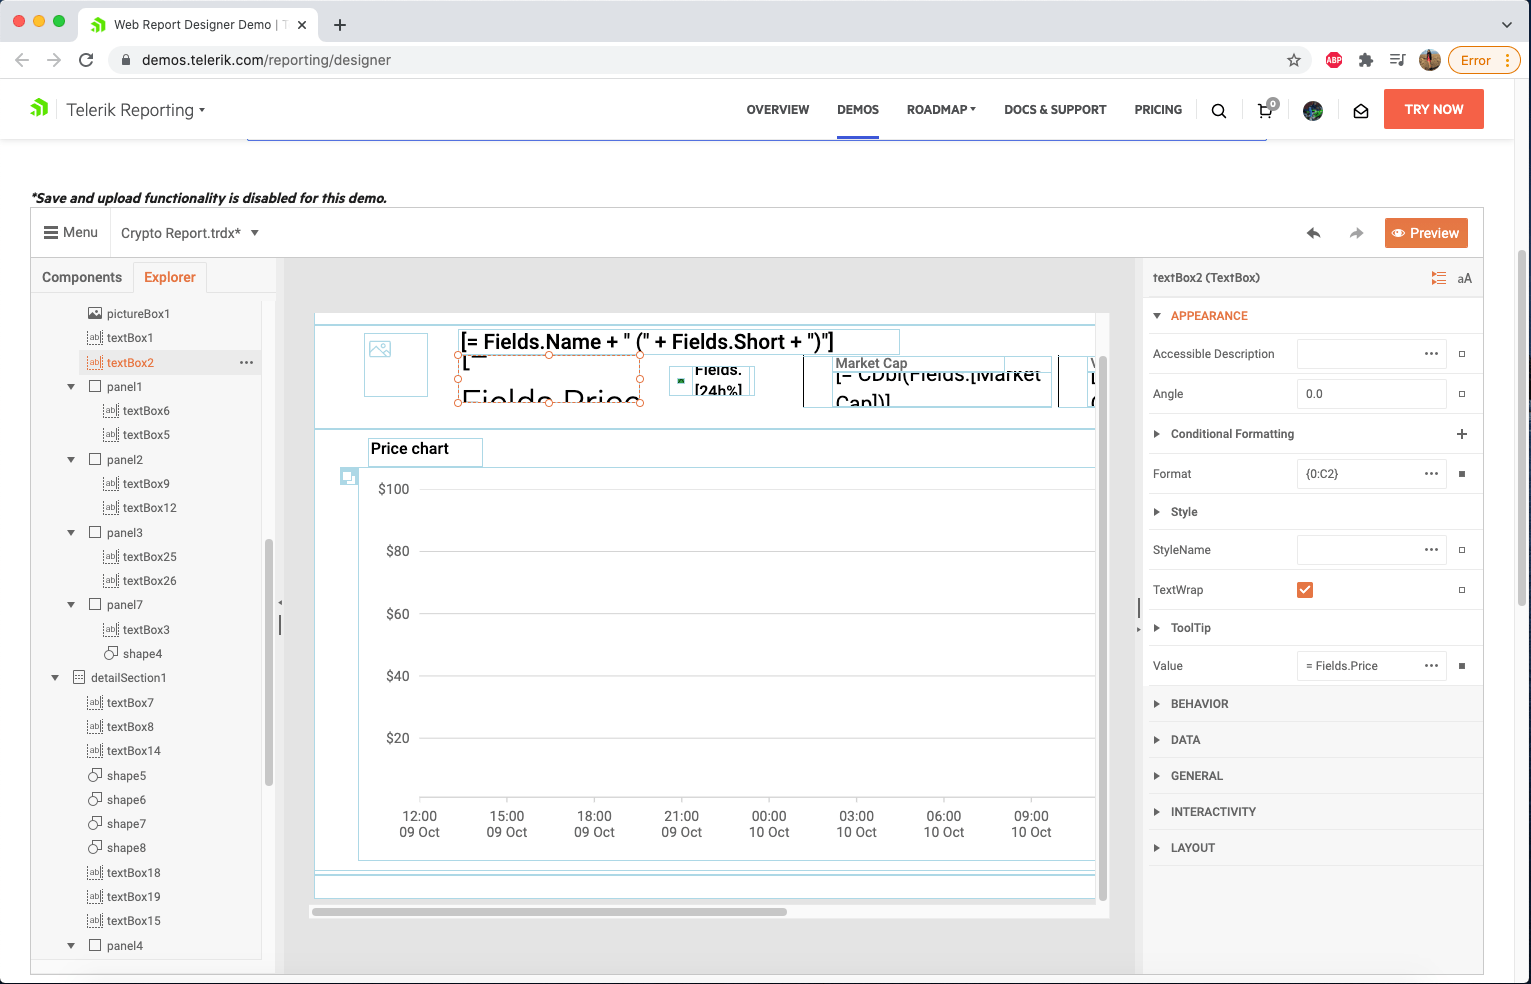
Web Report Designer
The Web Report Designer—our latest report designer—is an HTML5/JavaScript/CSS3 jQuery-based widget that allows you to easily integrate a report designer into your .NET Framework and .NET Core web applications by using a Visual Studio item template. The tool provides a smooth experience to your end users. When they need to change predefined reports, skew the layout, change a field formula or add conditional formatting—they can accomplish this without leaving the comfort of the apps that you created for them to use.
In R1 2021, we also added a dedicated Blazor component implemented on top of the Web Report Designer. You can also embed the Web Report Designer in your Angular application. Find more information in the Displaying the Web Report Designer in Angular application KB article.
The designer can produce and edit both XML report definition format (.trdx) and the optimized package report definition format (.trdp).
A demo of it can be found in the installation folder of Telerik Reporting (by default at C:\Program Files (x86)\Progress\Telerik Reporting <Version>\Examples\CSharp .NET Core folders) and in our online demos:
Desktop Report Designers
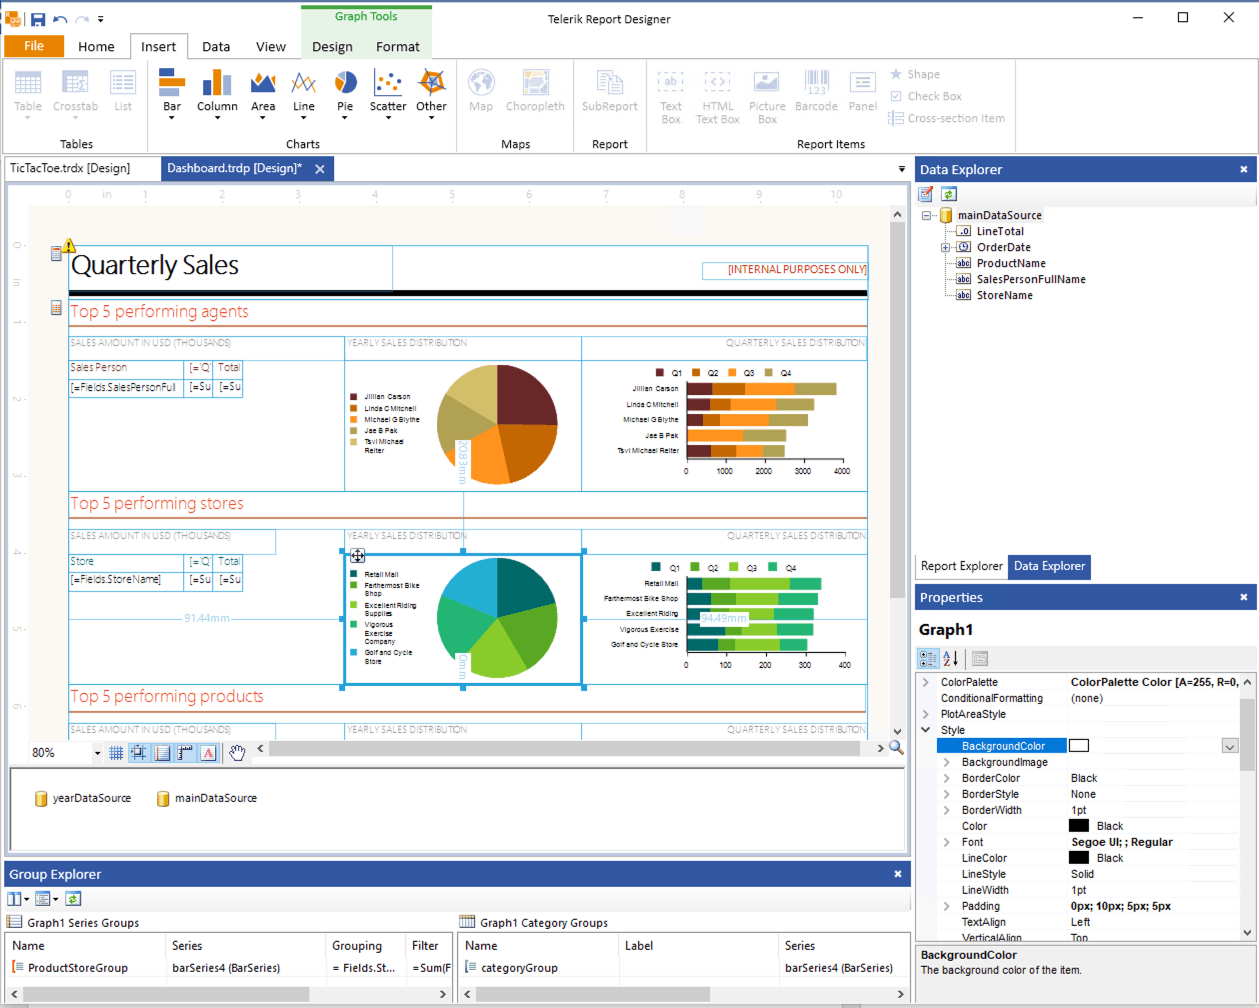
We have developed two .NET Framework report designers:
Standalone Report Designer—a single self-contained executable file, which simplifies its distribution as it does not require installation. The designer works with .TRDP and .TRDX report definitions and it can be found in the installation folder of Telerik Reporting:
C:\Program Files (x86)\Progress\Telerik Reporting <Version>\Report Designer.
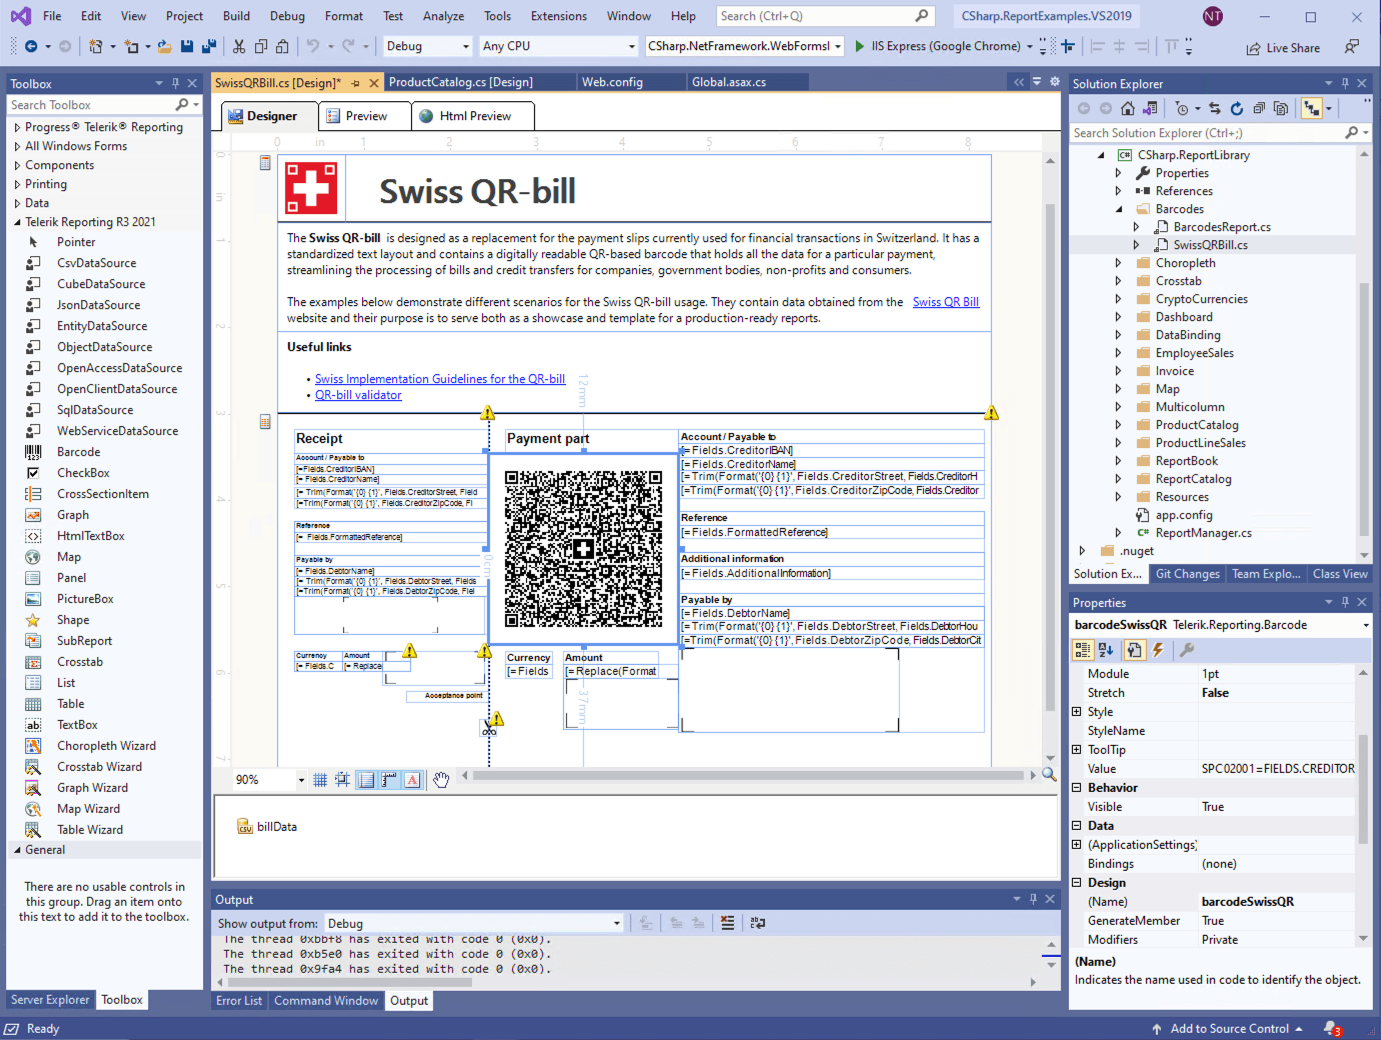
Visual Studio Report Designer—dedicated to editing CLR/type report definitions (i.e. CS or VB files) in the Visual Studio environment. You can create a report with it by using Visual Studio and the dedicated new report item templates in it.
Report Viewers
Now let’s step into the galaxy of report viewers. Once you have created the report, you can easily embed it into your .NET Framework or .NET Core application through some of the report viewers that we provide. The same applies when it comes to the JavaScript world—Angular, React, Vue. Now let’s give an in-depth examination of some of the technologies that we support.
.NET Core Applications
In R1 2019, we introduced full support in Telerik Reporting for .NET Core applications running on Windows, Linux and macOS.
Now you might ask what you need to show a report in your .NET 5 application. Ok, the answer is easy. For web applications, you need the HTML5 Report Viewer and a running instance of the .NET Core implementation of our Telerik Reporting REST service or the Telerik Report Server. They will do the whole magic for you.
Here it is important to mention that the default implementation of the report viewer supports mobile as well as desktop browsers. The responsive layout adapts itself to the device display for best viewing experience.
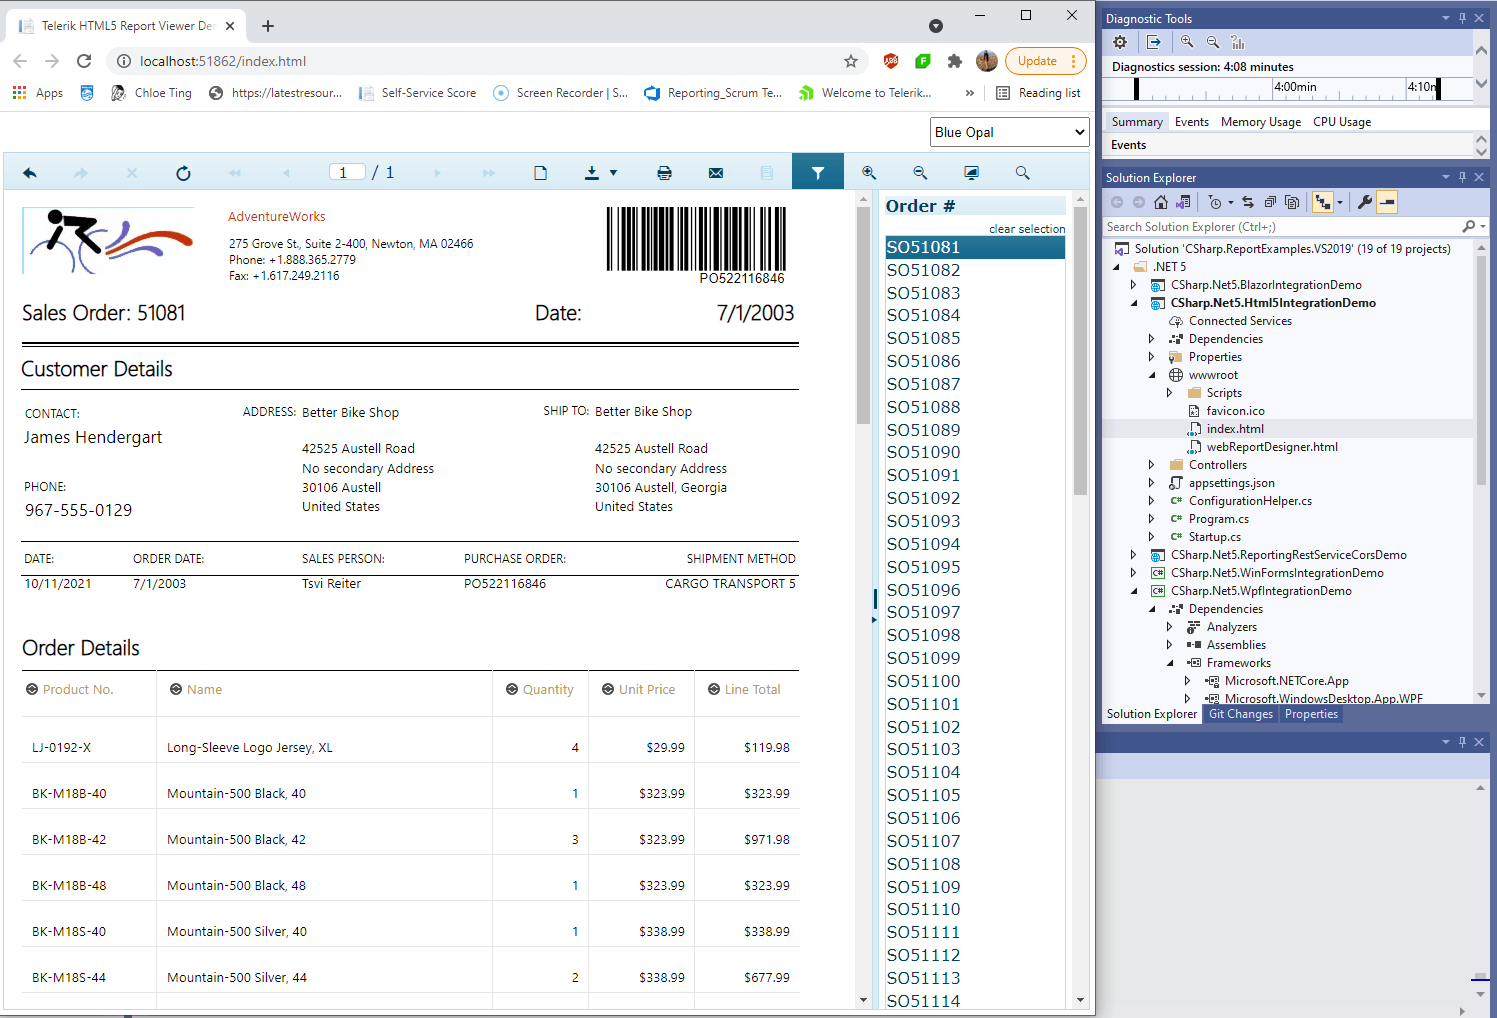
What if you have a WPF or WinForms application that runs under .NET Core?! You are covered. You can use the Windows Forms Report Viewer or the WPF Report Viewer.
Again, demo projects can be found in the installation folder of our product:
C:\Program Files (x86)\Progress\Telerik Reporting <Version>\Examples\CSharp – .NET6, .NET5, .NET Core 3.1 and .NET Core 2.1 folders.
Blazor
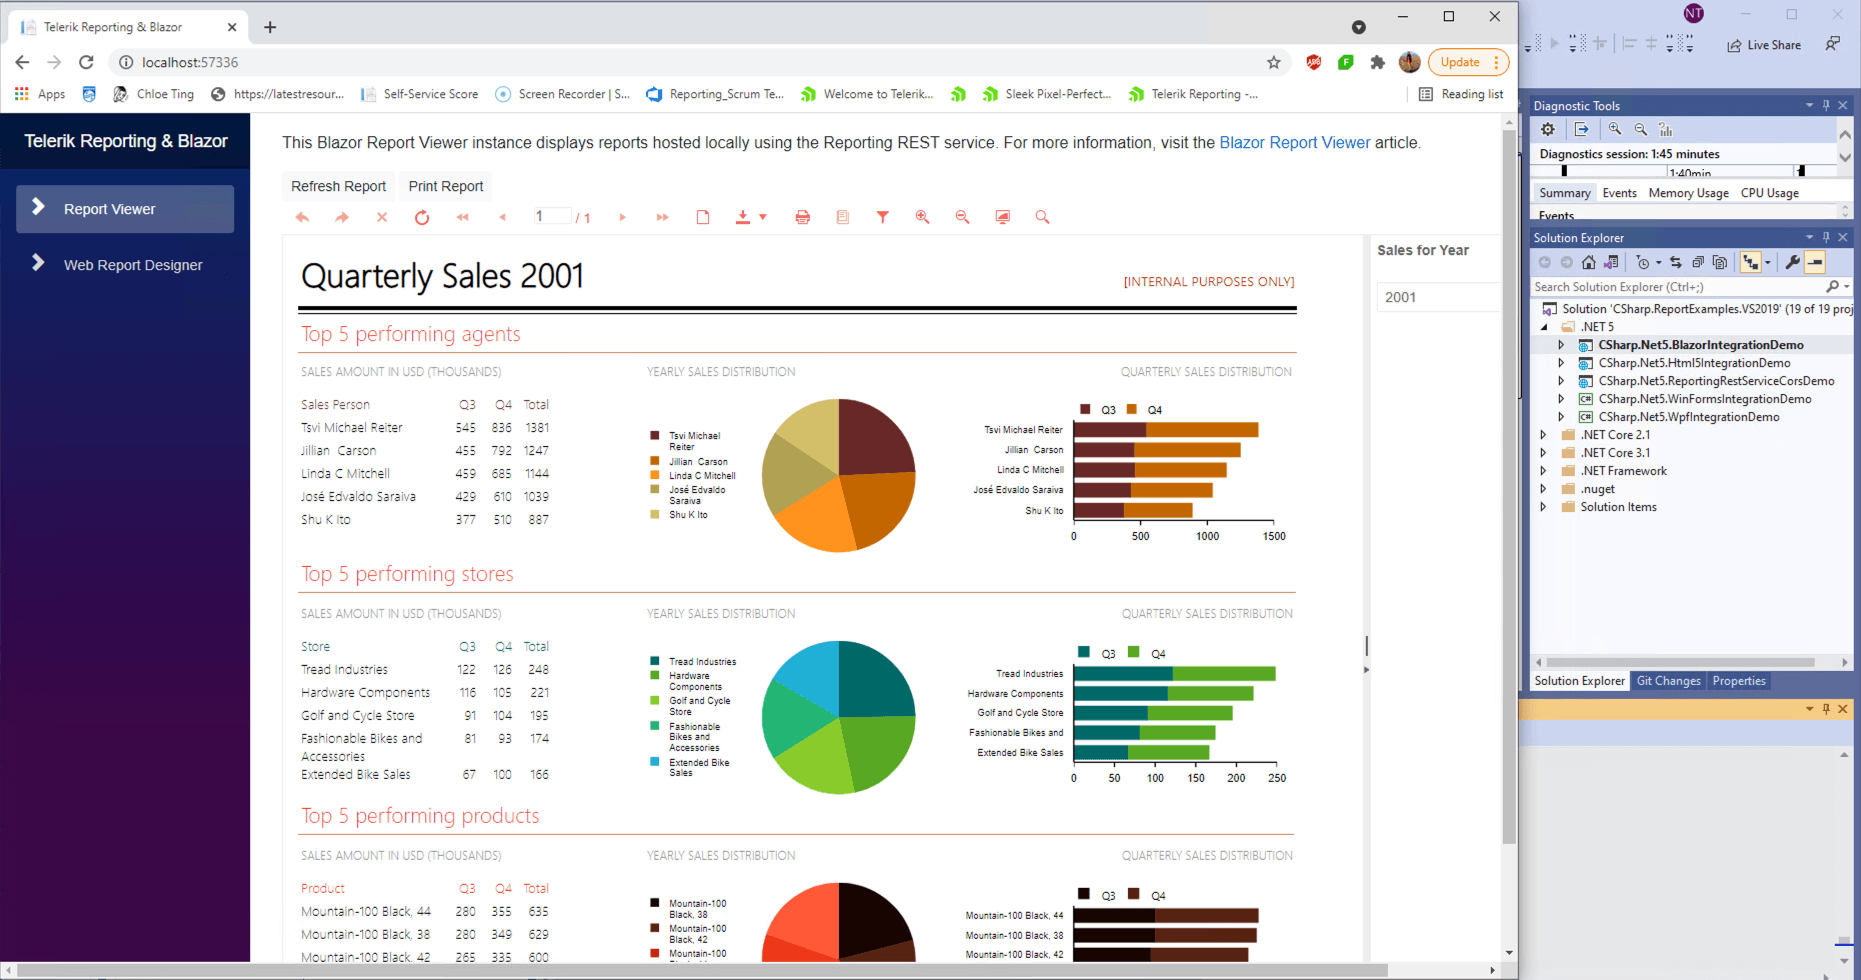
Blazor has gained a lot of popularity during the last several months. For that reason, in R1 2020, we added the new Blazor Report Viewer which is based on the HTML5 Web Report Viewer. One release later, in R2 2020, we upgraded it and right now you can cover more complex scenarios. A demo with this viewer is located in the folder with samples.
.NET Framework Applications
Below you can see a list with the dedicated report viewers that you can effortlessly add to your application by using the Visual Studio item template. You just need to right-click over the project menu -> Add -> New Item and select the report viewer based on the type of project:
HTML5 Report Viewer—a pure HTML5/JavaScript/CSS3 jQuery-based widget that allows embedding Telerik Reporting reports in an HTML page.
HTML5 MVC Report Viewer—a server-side wrapper that can be used in MVC applications. The MVC wrapper is built on top of the HTML5 Report Viewer, and it exposes all the HTML5 Report Viewer options. The MVC wrapper renders the widget with the configured options on the page.
HTML5 WebForms Report Viewer—a wrapper that can be used in WebForms applications. Again, here you can use all the potential of the HTML5 Report Viewer.
Windows Forms Report Viewer—the viewer is designed to render Telerik Reports within Windows Forms projects.
WPF Report Viewer—allows you to deliver reports produced by Telerik Reporting to any rich application developed with WPF.
A sample project with each viewer can be found in the Examples/.NET Framework subfolder of the product installation folder.
Angular
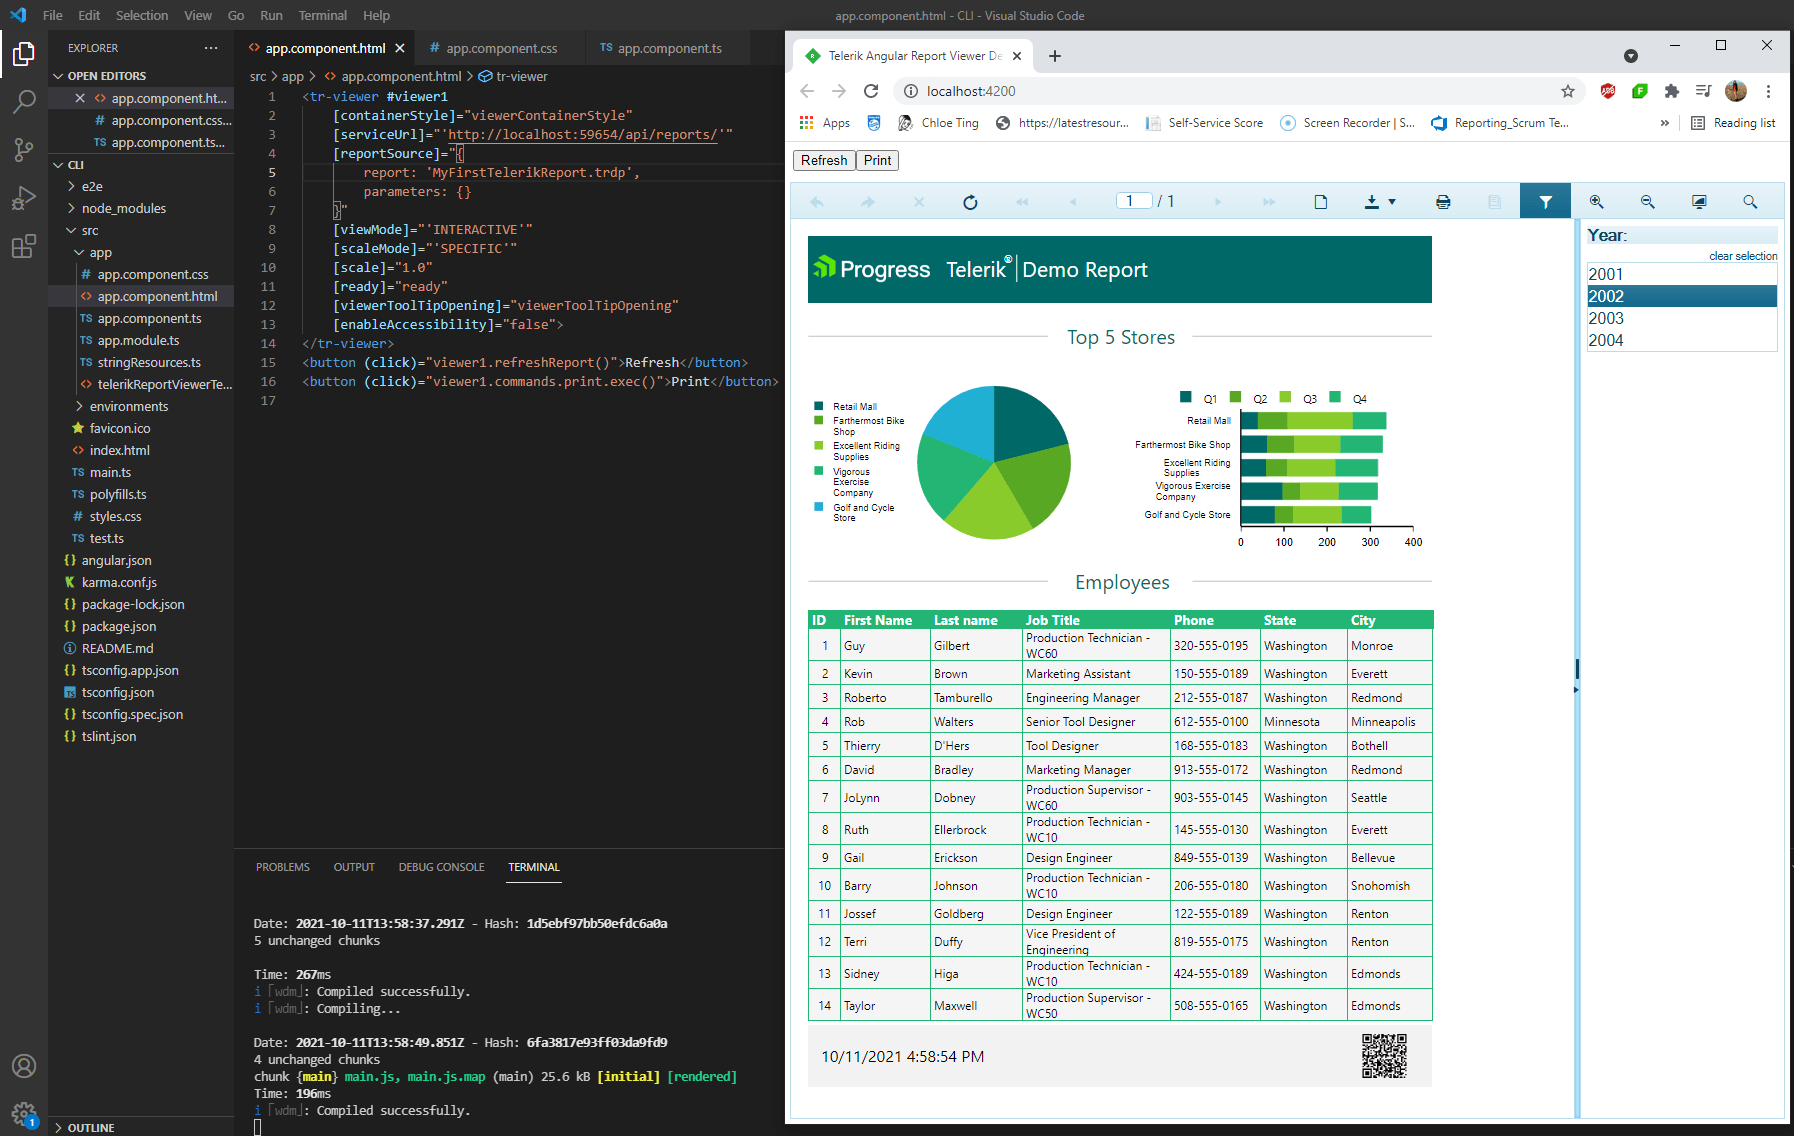
You can embed the Angular Report Viewer in your Angular applications regardless of the module loader that you use (webpack or SystemJS). The component is based on the HTML5 Report Viewer and it also requires a running instance of the Telerik Reporting REST service. A demo project of Angular Report Viewer with SystemJS and a of the Angular Report Viewer with Angular CLI can be found in:
C:\Program Files (x86)\Progress\Telerik Reporting <Version>\Examples\Angular.
React and Vue Applications
As we mentioned earlier, the HTML5 Report Viewer is built upon HTML5, CSS and JavaScript. This allows the viewer to be used in virtually any JavaScript framework. You only need to add the viewer’s dependencies and assets, and again don’t forget about the REST service. All required steps and sample projects can be found in the following knowledge base articles:
WinUI 3 Desktop Application
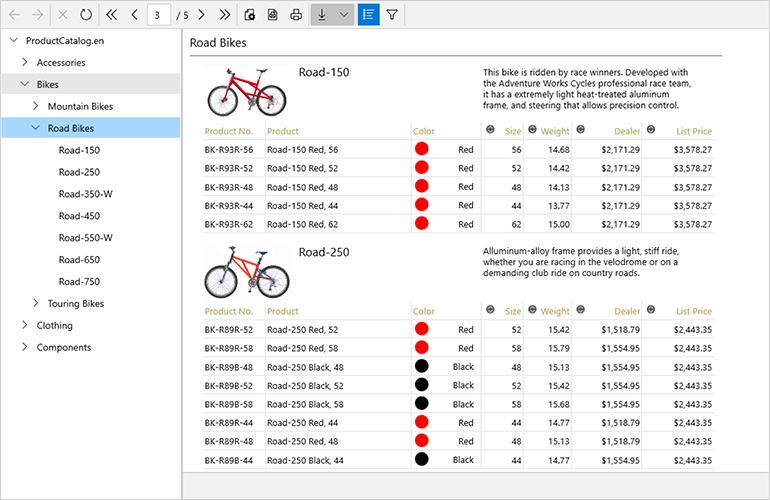
In R3 2021, we released the WinUI Report Viewer that can be embedded in WinUI 3 desktop applications. The control is a composite of Telerik UI for WinUI desktop controls and we provide a sample project in the Examples subfolder of the product installation folder.
UWP
You have the ability to display a report in your UWP application. This is completely possible by utilizing a WebView with integrated fully functional Telerik HTML5 Report Viewer and creating a report document by invoking Telerik Reporting REST service endpoints. Find more information and a demo in the How to integrate Telerik Reporting in UWP application knowledge base article.
Collaboration With Other Progress Products
Personally, I love how Telerik Reporting can collaborate with other Progress products. We have a really nice example of how Blazor DataGrid Meets Blazor Report Viewer or see how the data from the Telerik UI for MVC Grid can be passed to a Telerik Report. There are hundreds of scenarios that you can test. It only depends on your imagination.
Want To Try Telerik Reporting?
Telerik Reporting is a complete, easy-to-use and powerful .NET embedded reporting tool for web and desktop applications that supports: Blazor, ASP.NET Core, ASP.NET MVC, ASP.NET AJAX, HTML5/JS, Angular, React, Vue, WPF, WinForms and UWP. Also available as a part of our Telerik DevCraft bundle, Reporting allows you to create, style, view and export rich, interactive and reusable reports to attractively present analytical and any business data. Add reports to any business application through report viewer controls. Export the ready reports in more than 15 formats.
If you still have not tried it, you can start a free trial to take a closer look. We also provide a support service we are proud of and resources that will help you along the way.

Neli Todorova
Neli Todorova was a Technical Support Engineer in the Telerik Reporting division.
