Blazor DataGrid Meets Blazor Report Viewer

Summarize with AI:
Telerik UI for Blazor offers a great way to interact and visualize manipulated data through its Grid component, while Telerik Reporting can communicate data in a unique way. We have brought the two together to demonstrate how you can easily modify the dataset to what you want, and display it in reports.
Telerik Reporting is useful for displaying data in multiple ways, like through graphs, tables, statistics and more. Each report can be designed and tweaked in the Designer to make it perfect for what you need it for, and the dataset can be filtered, sorted and grouped based on expressions and parameters. Though the manipulation of the data can be done in very high detail, it is not the easiest in the parameter-field of the viewer when the whole application is live.
Instead, the Grid from Telerik UI for Blazor lets you work with the data in the browser and fine-tune the dataset to include only the rows you want. It provides instant visual feedback for the changes applied and makes it easy to understand. Though the grid can be exported in various formats, there is more flexibility in the Reporting software to, for example, create great PDFs.
The idea is to combine the strengths of each tool, and provide the user with an intuitive way of interacting with the data, and then immediately offer advanced reports, that, even though they are premade, are based on the same dataset the user interacted with.
Demo Application
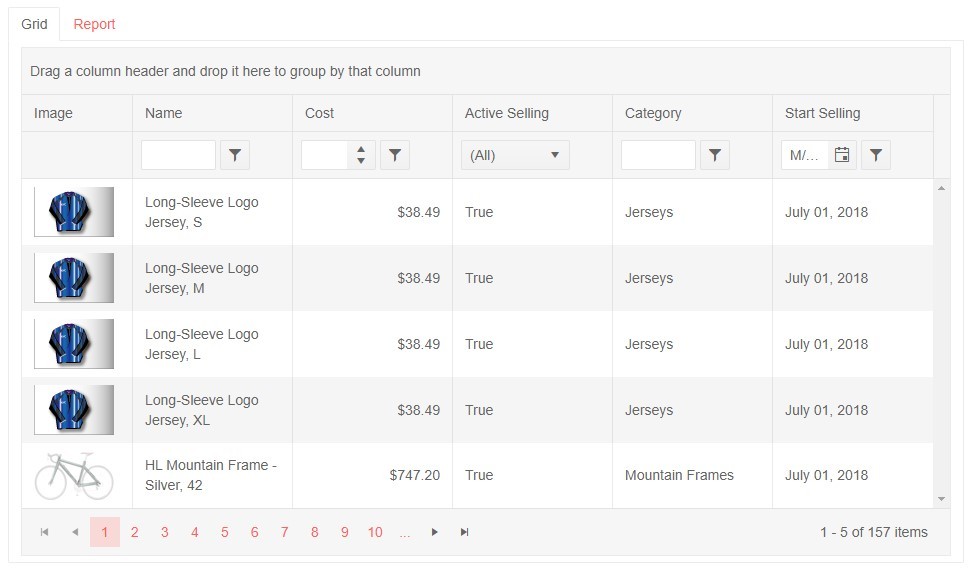
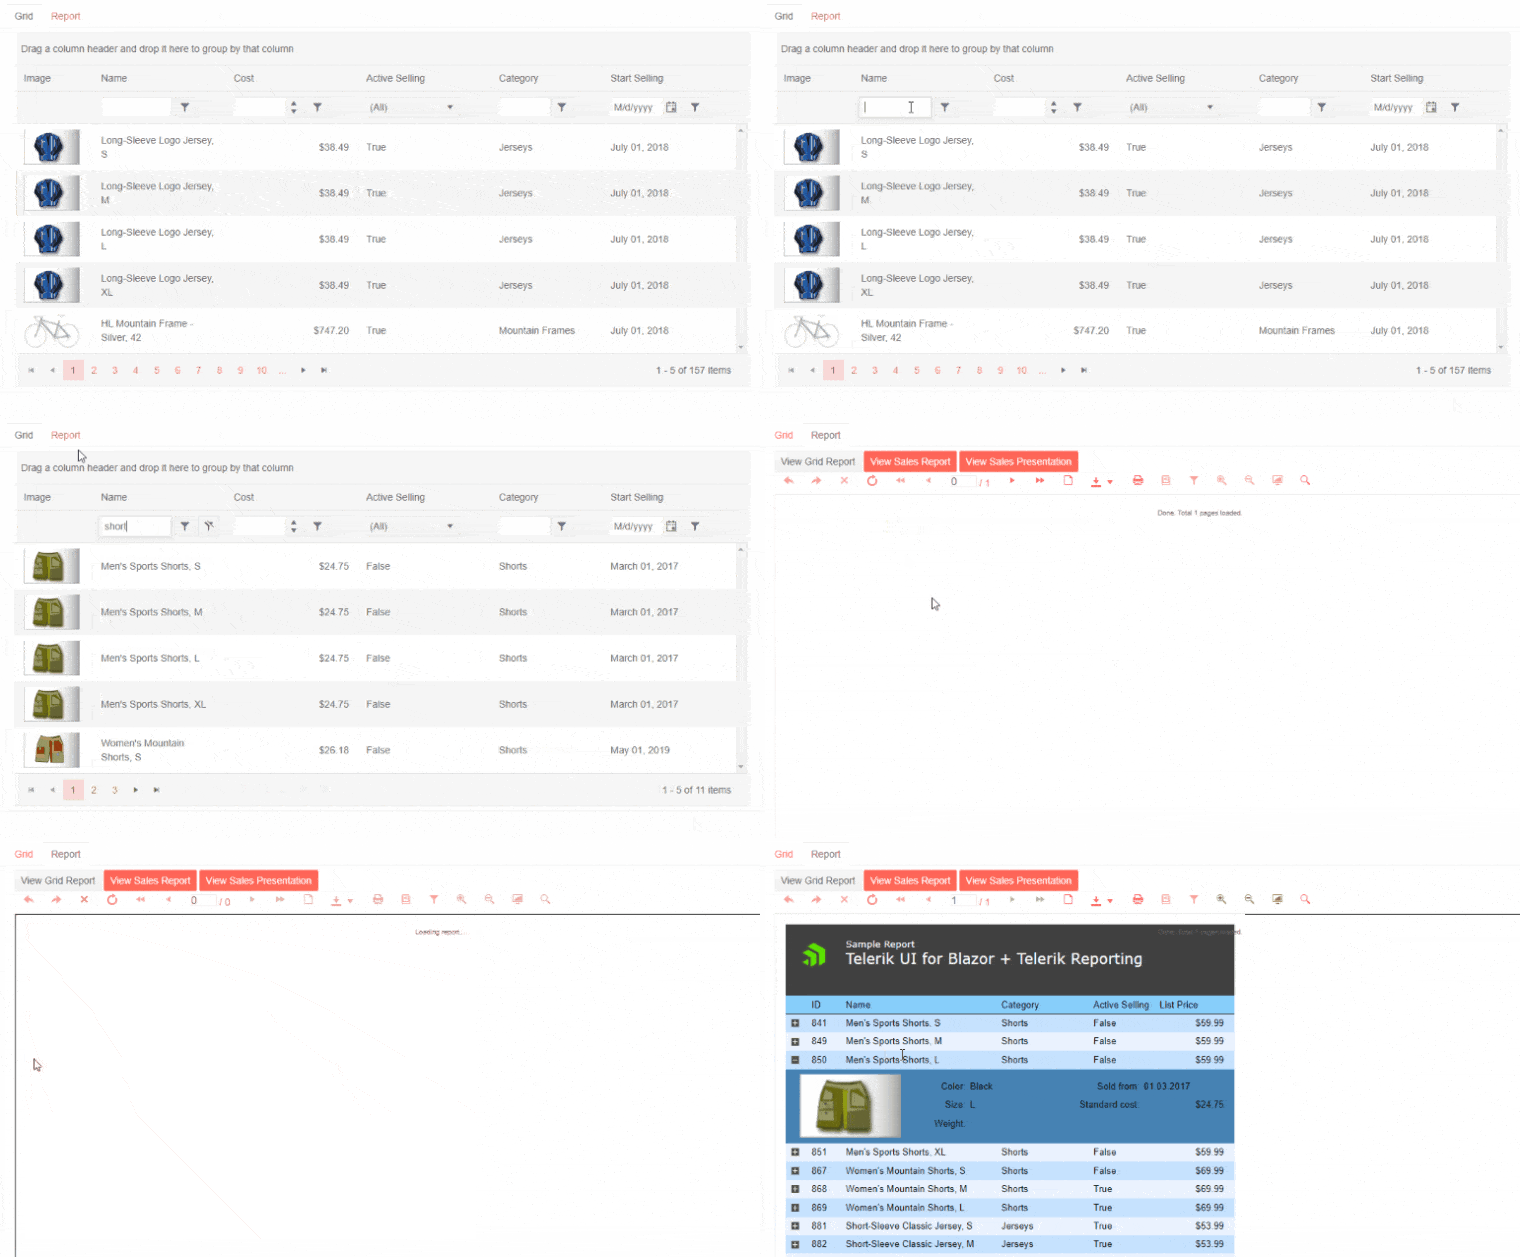
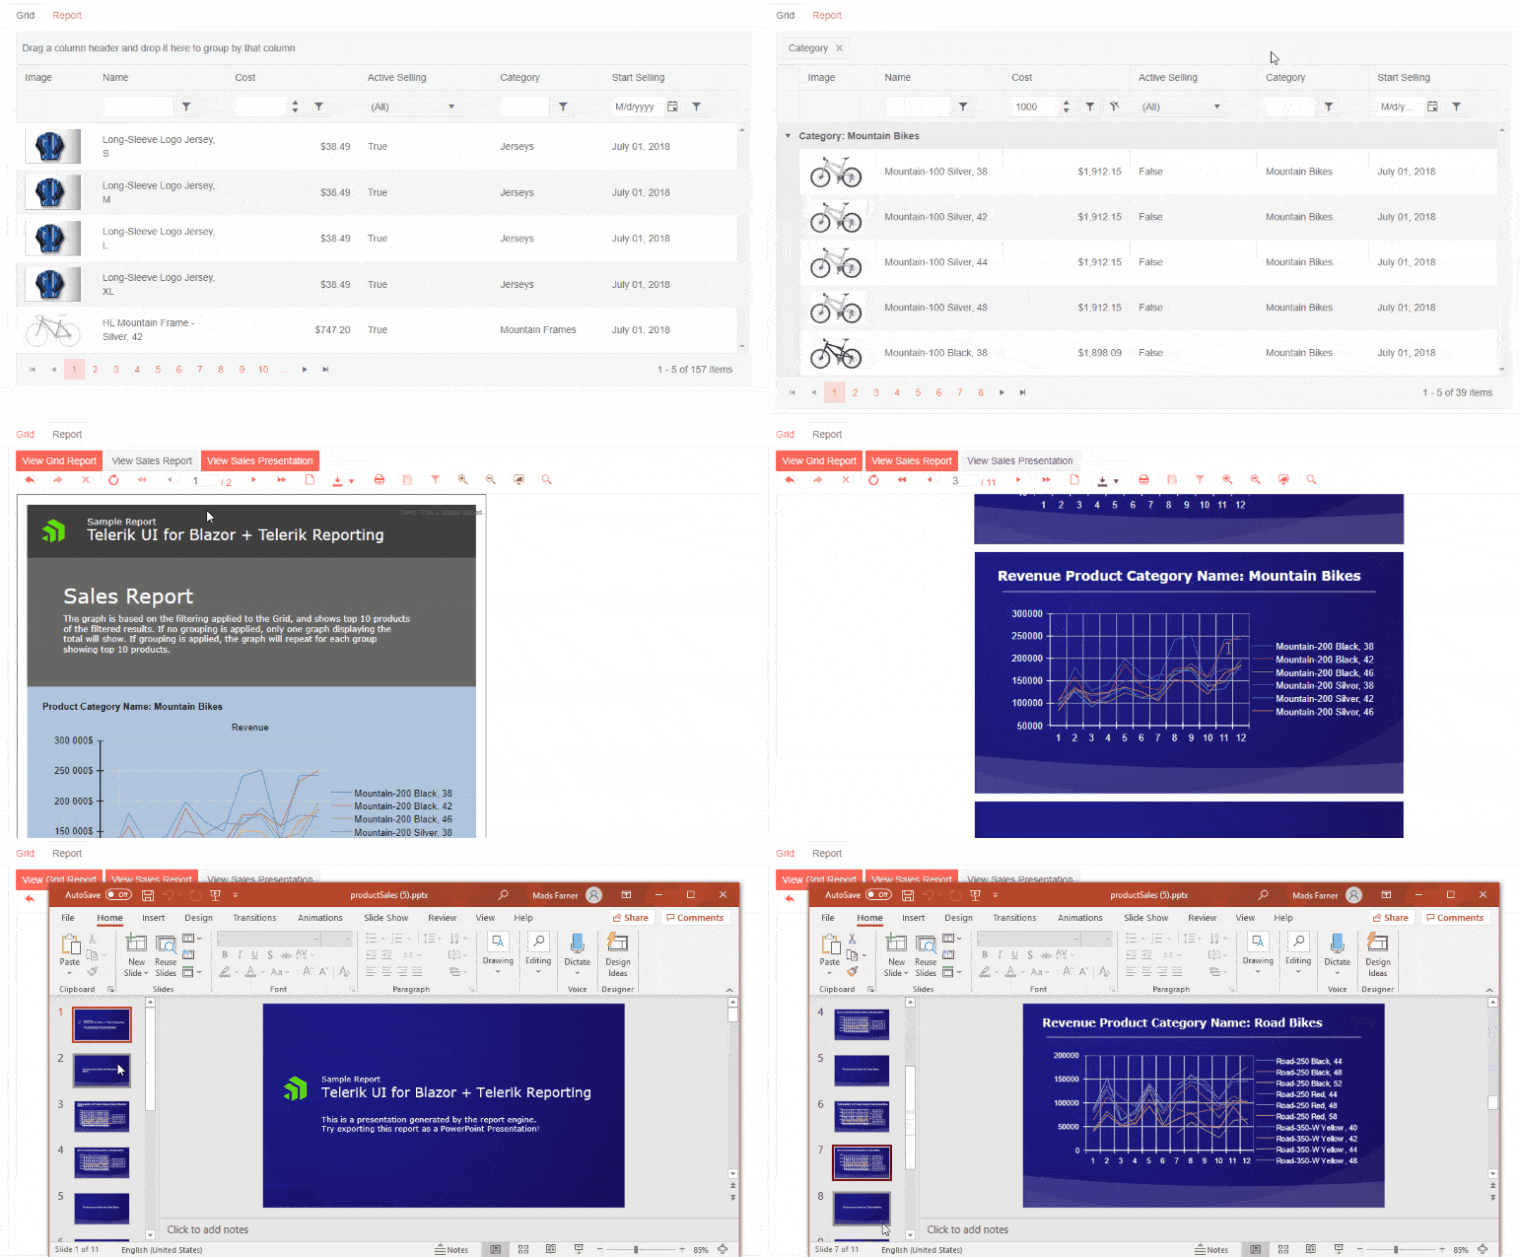
For this post we created a working demo to display an example of what this might look like. The source code for this project can be found on GitHub. In this application we use some of the sample data provided by the AdventureWorks database to display different products in the Grid. The user can apply filters, sorting and grouping to these data, and those will be provided to the Reporting Engine when Reports are rendered. We created a few sample reports that display data in different ways, like for example a sales report.

The Telerik UI for Blazor Grid shown above is based on the same grid you find in the online UI demos, with a few differences. Each time changes are applied to the grid, these get stored as JSON data as well as in the grid-state. This JSON data is then ready to be passed with the request to the Report REST Service when the Report Viewer is loaded. Because the request contains custom JSON data, this needs to be handled in a custom way inside the REST Service, which is done by implementing a report resolver that handles the request and translates the embedded data so that it can be applied to the report.

Razor Page Setup
Inside the project-files, the Pages/Index.razor is the file that contains both the Grid for Blazor and Report Viewer tag for Blazor in addition to the functions to generate the JSON data.
public void SetReportSourceJson(GridState<Products> gridState)
The method above takes the gridState as a parameter, which is where we can find all the filters, sorting and grouping applied to the grid. In addition, the function stores what report-file to load and the actual data from the grid, into JSON data.
When the tab is switched over to Report, the Report Viewer is loaded. As part of its tag, the viewer's ReportSource property is set to the JSON data.
On this razor page, we also added functionality to switch reports with buttons. Once the Report tab is open, three buttons let the user choose between three reports, and when clicked, changes the name of the report and triggers the SetReportSourceJson function above.
Report REST Service
The Controller receiving the viewers requests for rendering reports is set up in the usual way explained in the documentation, except for the custom ReportSource resolver. In our demo project it's the class called GridReportSourceResolver.cs and is used by the ReportsController to find which report to load and return its definition. This is where we implement the custom functionality to handle this request, as the request does not contain data structured in a default way, but instead the JSON data we created in the razor page.
ReportSource Resolve(string report, OperationOrigin operationOrigin, IDictionary<string, object> currentParameterValues)
The Resolve method is called by the controller and supplies the data that is embedded in the request through parameters. The first one of these, the string 'report', is the entire JSON data which we now can deserialize and read. Next, the report file itself is deserialized and we can now start changing the definition.
In the scenario of the first report called "DataGridExampleReport.trdx", the report has a JSON data-source, but the content is empty. Since the entire dataset is provided through the embedded data, we can update the reports data source.
var report = this.gridReportInstance.Report;
var reportDataSource = (JsonDataSource)report.DataSource;
reportDataSource.Source = productJson;
Applying the Filters, Sorting and Grouping
Still inside the GridReportSourceResolver.cs, the last half of the file is methods used to convert and apply the filters, sorting and grouping to the report. The three methods BindFilters, BindSorts and BindGroupByParameter take in the deserialized data as parameters.
To apply the filters, a translation is needed to work in the report. The Grid and Reporting handles filters in slightly different ways, so here we created a explicit translation for each filter-type. For this reason, a separate method was created
private Filter ToReportingFilter(ReportSourceFilter filter)
It takes in the an object where the filter is defined the same way the Grid uses it. Both the Grid and Reporting are comparing two values or expressions with an operator in between to apply filters. The difference is that the Grid has more operators than Reporting. E.g. Reporting does not have a "IsEmpty" operator, and in this case we return:
return new Filter("= Fields." + filter.member.Value, FilterOperator.Like, string.Empty);
Applying sorting is simpler then the filters, as it only defines what field to sort by, and whether it should be ascending or descending.
Grouping is solved in a different way. When designing the reports, I created a grouping of the data, but based on a static value, like "1". This results in that all data rows will be grouped together, and it's not until we change that value that we will actually create multiple groups. I will explain this in more detail in the next section.

Report Design and Setup
I am not going into great detail about the design of the report itself, but because the possibility to set groups relies on the design, I will explain this part.
For all three reports used in the demo, the reports have been designed with one group applied to the data source. The value this grouping is based on is static, in this example the string "1", which causes all data-rows to be in the same group. To easily change this value, it is based on a report parameter. The group expression and the sorting for the group is based on the following expression:
= Fields(Parameters.groupedBy.Value)
If a valid field from the data-source is provided as value for the parameter 'groupedBy', the report will divide the rows into groups based on that field. When the default value 1 is provided, all rows go into the same group.
To make the report itself better adapt to the changes of applied grouping, some sections and elements have conditional formatting to hide them. E.g. the group-header of the Grid Report is only visible when a grouping is applied.
Learn More and Try for Yourself
Want to try it out for yourself? You can learn more about Telerik UI for Blazor and Telerik Reporting and start free trials at the links below, and remember that the source code for this project can be found on GitHub.
Try Telerik UI for Blazor Try Telerik Reporting
Also Available in Telerik DevCraft
Both Telerik UI for Blazor and Telerik Reporting are also available as part of Telerik DevCraft.
DevCraft is the most powerful collection of Telerik .NET and Kendo UI JavaScript developer tools, which includes modern, feature-rich and professionally designed UI components for web, desktop and mobile applications, reporting and report management solutions, document processing libraries, automated testing and mocking tools. DevCraft will arm you with everything you need to deliver outstanding applications in less time and with less effort. With award-winning technical support delivered by the developers who built the products and a ton of resources and trainings, you can rest assured that you have a stable provider to rely on for your everyday challenges along your software development journey. Learn more about Telerik DevCraft.

Mads Farner
Mads Farner was a Technical Support Engineer on the Telerik Reporting team.
