Building Serverless Web Apps With Blazor Chart—Part 2: Creating the Client

Summarize with AI:
In this post, we’ll work through the steps needed to create the demonstration Blazor client application before subsequent integration with each of the “big three” cloud providers.
Introduction
Welcome to this second article in a series demonstrating how to create a Blazor client application that incorporates a Telerik UI For BlazorChart component.
Series Contents
- Part 1: Series introduction and cloud provider comparison
- Part 2: Blazor & Telerik client application (this post)
If you’re planning to follow along with this series, you will need to create a Blazor client application, following the instructions in this article. Having completed that step, we’ll then look at creating a backend API.
If you already have a preferred cloud provider, you can go straight to the matching article.
If you’re interested to learn how the experience compares between the cloud providers, a succinct comparison is in Part 1, and you may further be interested in reading all three of the platform-specific articles in this series.
What Are We Doing in This Article?
We’re going to create a demonstration Blazor client application that incorporates a Telerik UI For Blazor Chart component. We’ll demonstrate a working chart that, initially, uses a locally stored dataset.
An objective of this series is that we want to demonstrate how we could use backend solutions from various different cloud providers, so in later articles, we’ll relocate our data source into the cloud.
In the subsequent articles of this series, we’ll create simple API backends using Azure, AWS and Google Cloud and then connect everything together.
Requirements for This Article
The main requirements for this article include:
- .NET 6.x or higher SDK installed
» We can download .NET for free from Microsoft.
- Visual Studio Code installed (in this article, we’ll abbreviate it to VS Code)
» We can download VS Code for free from Microsoft.
- The following extensions for VS Code:
» C# for Visual Studio Code
» BlazorWasmDebuggingExtension
» Telerik UI for Blazor Template Wizard - Telerik UI for Blazor installed
» We can download a free trial from Progress or use a paid license if we have one available to us.
- Experience with:
» C# and Razor syntax
» .NET for web development, in general
» VS Code
Note: For the purpose of this article, we’ll be using CLI(s) and VS Code, because it is a cross-platform approach that better accommodates a wider range of readers. For those readers who prefer VS 2019 on Windows, everything we cover in this article is also available within that IDE.

Image credit: cottonbro on Pexels
Options for Adding Telerik Components to a Blazor App
There are a number of ways we could go about creating a Blazor application using Telerik components:
- We could create a new Blazor application first—and then manually configure the Telerik components in the project ourselves.
» This would require us to add Telerik NuGet packages and client assets (such as
cssandjsreferences) and then make various code configurations.
» Microsoft: Blazor Tutorial—Create your first Blazor app
» Telerik: What You Need to Use the Telerik Blazor Components - We could use the Telerik UI for Blazor Template Wizard to generate a completely new Blazor project.
» This is an IDE extension available for both VS 2019 and VS Code.
» The wizard would obtain all the required resources and automatically configure a basic project for us:
» Telerik: Getting Started / Visual Studio Code Integration: Create New Projects - We could take an existing Blazor project and use the Telerik UI for Blazor Template Wizard to automatically upgrade the project:
» Telerik: Getting Started / Visual Studio Code Integration: Convert to Telerik Application
Note: Later in this article we’ll demonstrate the above third option. This is intended to accommodate readers who may already have an existing Blazor project, by showing how easy it is to upgrade a Blazor project with Telerik.
Use the CLI To Generate a New Blazor Project and Solution File
Let’s get stuck in!
The overall solution that we’re going to create here will contain a single project for the Blazor client app (that we’re making in this article).
Later, we’ll introduce further additional backend projects that will be implementations appropriate to the various cloud providers.
Create a .NET Solution
Firstly, we’ll create a new .NET solution: At the command prompt, enter the commands that appear below:
- Navigate to the folder where you normally keep your code. For example,
/users/source/repos. - Create a new folder for the overall solution and navigate into it. In this demo, we’ll call it
BlazorTelerikCloudDemo. - Use the .NET CLI to create a new solution file.
md BlazorTelerikCloudDemo
cd BlazorTelerikCloudDemo
dotnet new sln
Create a Blazor Project
Next, we’ll create a Blazor project by entering these additional commands. These will:
- Create a new subfolder, used for the Blazor project itself, and navigate into it. In this part of the demo, we’ll call it
BlazorTelerikClient. - Use the .NET CLI templating feature to create a new Blazor project.
» Specifically, we’re going to create a BlazorWasm project as opposed to BlazorServer.
» Note that we don’t specify a project name—the tools will detect the name of the folder that we are currently in—and use this for project naming.
md BlazorTelerikClient
cd BlazorTelerikClient
dotnet new blazorwasm
Next, we’ll add the project to the solution. Use the following .NET CLI commands—like this:
cd..
dotnet sln add BlazorTelerikClient
(Optional) Remove Unused Content Created by the Template
This step is purely optional and it’s ok to skip straight ahead to the next section.
The template provides a sample homepage, along with a pair of demonstration pages: Counter and FetchData. For the sole purpose of decluttering our demo, we can remove items related to these two pages without causing a problem:
- Within the folder
/Pages, remove both of the filesCounter.razorandFetchdata.razor. - Using VS Code, open the file
/NavMenu.razorfor editing. Within the markup of this file, locate the two redundant navigation menu items and remove them. If you are uncertain, look out for<li>elements with acssclass ofnav-item—both are children of the parent<ul>element. - Within the folder
/wwwroot/sample-data, remove the fileweather.json.
Don’t delete /Pages/Index.razor—we’ll be repurposing this homepage in a moment.
Convert Existing Blazor Project to a Telerik UI for Blazor Project
Next, we want to convert our Blazor project to one that uses Telerik UI for Blazor components.
Although it’s entirely possible to manually convert an existing project to use the Telerik UI components, it’s far more convenient to just use the tooling provided by Telerik to automate the process.
To do this, follow these steps using VS Code:
- Open our Blazor project folder.
- Select the Extensions tab (on the left by default). If not already added as a VS Code extension, install it now:
- Press Ctrl + Alt + P (Cmd + Alt + P on Mac) to open up the VS Code Command Palette—this is used to access many commands.
- With the Command Palette showing, search for and select “Telerik UI for Blazor Convert Command.”
» Selecting this command will cause the wizard to process our project and automatically make a number of updates to various files.
- (Optional) To ensure the wizard has made the necessary changes, perform a quick “spot check”—review the following files for expected changes (this is not an exhaustive list of all changes!):
» Open the file
BlazorTelerikClient/BlazorTelerikClient.csproj—we expect to see a newPackageReferencetoTelerik.UI.for.Blazor
» Open the fileBlazorTelerikClient/program.cs—we expect to see a new line addedbuilder.Services.AddTelerikBlazor();
Add a Sample Dataset To Work With
Initially, we’re going to keep things simple and just use a dataset that is stored in a local file. The data will be in the .json format.
We’ll use a pre-prepared dataset which happens to be about the subject of “Big 3 Cloud Providers – Search Trends, over time.” This data has been sourced from Google Trends and saved into a JSON format, ready for use:
- Visit the link to GitHub, below, and copy the entire contents:
https://raw.githubusercontent.com/SiliconOrchid/BlazorTelerikCloudDemo/master/cloud-searchtrend-data.json - Create a new text file called
cloud-searchtrend-dataand save it to the following location within our project:BlazorTelerikCloudDemo/BlazorTelerikClient/wwwroot/sample-data/cloud-searchtrend-data.json
By placing the dataset in this location, it will be published to the website that is hosting our Blazor application (along with any other artifacts).
This approach makes the dataset as readily available as any other resource, such as an image or stylesheet.
The dataset itself is straightforward, containing just over 200 elements that represent monthly data points between 2004 to 2021. Each element looks similar to this:
{
   "Date": "2004-01-01",
   "Azure": 0,
   "AWS": 0,
   "GCP": "0"
 }
Note: Don’t worry about what the data itself represents (e.g., whether it is accurate, etc.)—as this is completely unimportant. We’re just interested in some sample data that includes a whole bunch of data points based upon dates.
Add a Telerik UI Charting Component

Image credit: Nataliya Vaitkevich on Pexels
At this stage, our Blazor application is configured and ready to work with Telerik components. We now need to add an actual component to work with.
In this demonstration, we’re going to use the Telerik UI for Blazor Line Chart component. This is a perfect selection because it is a visually rich component that is ideal for demonstrations.
Primary documentation:
- Telerik: Blazor Line Chart Demo
- Telerik: Blazor Chart Documentation—Overview
- Telerik: Blazor Chart Documentation—Line Chart
The .NET templating process has created some “hello world” type content. We’re going to replace this with our chart. Follow these steps:
- Using VS Code, open the file
/Pages/Index.razor. - Replace the entire contents of the page with the following:
@page "/"
@using Telerik.Blazor
@inject HttpClient Http

<TelerikChart>

    <ChartTitle Text="(Google Trends Data) - Cloud Provider Search Trend, over time."></ChartTitle>
    <ChartTooltip Visible="true"></ChartTooltip>
    <ChartLegend Position="ChartLegendPosition.Bottom"></ChartLegend>

    <ChartSeriesItems>
        <ChartSeries Type="ChartSeriesType.Line" Name="Azure" Data="@seriesData" Field="@nameof(SeriesDataModel.Azure)" CategoryField="@nameof(SeriesDataModel.Date)"></ChartSeries>
        <ChartSeries Type="ChartSeriesType.Line" Name="AWS" Data="@seriesData" Field="@nameof(SeriesDataModel.AWS)" CategoryField="@nameof(SeriesDataModel.Date)"></ChartSeries>
        <ChartSeries Type="ChartSeriesType.Line" Name="GCP" Data="@seriesData" Field="@nameof(SeriesDataModel.GCP)" CategoryField="@nameof(SeriesDataModel.Date)"></ChartSeries>
    </ChartSeriesItems>

    <ChartCategoryAxes >
        <ChartCategoryAxis BaseUnit="ChartCategoryAxisBaseUnit.Fit" Type="ChartCategoryAxisType.Date"></ChartCategoryAxis>
    </ChartCategoryAxes>
</TelerikChart>


@code {
    public SeriesDataModel[] seriesData;

    protected override async Task OnInitializedAsync()
    {
        seriesData = await Http.GetFromJsonAsync<SeriesDataModel[]>("sample-data/cloud-searchtrend-data.json");
    }


    public class SeriesDataModel
    {
        public DateTime Date { get; set; }
        public double Azure { get; set; }
        public double AWS { get; set; }
        public double GCP { get; set; }
    }
}
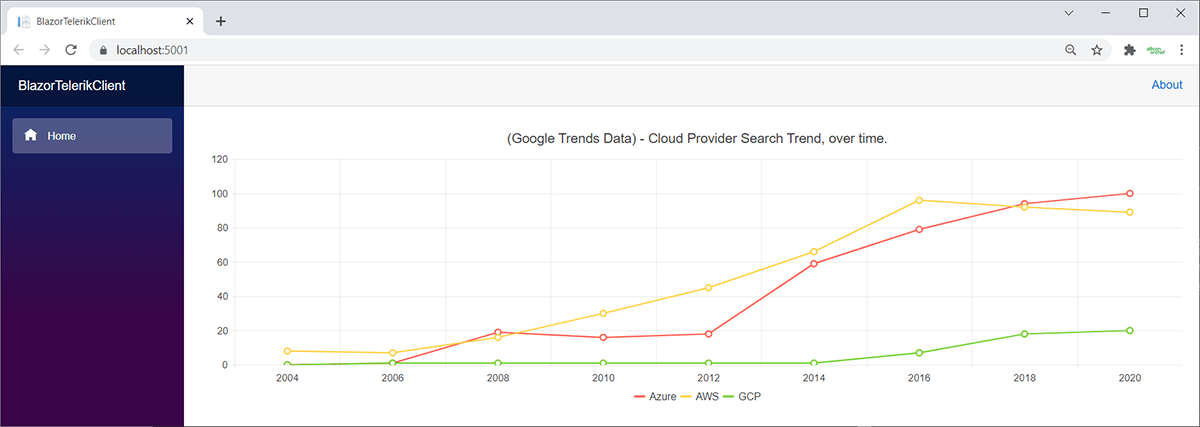
At this point, if we run the project (i.e., pressing F5 in VS Code), after a few moments we should see our application load with a chart that looks like the screenshot below:

Things To Focus On
Let’s call out some of the key points in the code that are worth acknowledging.
In the @code section:
- We’ve defined a strongly typed model class called
SeriesDataModel. - We’ve additionally created a property called
seriesDatawhich is an array of our model class. It is this property that is bound to the chart component. - Within the
OnInitializedAsync()method, we have a line that usesHttp.GetFromJsonAsyncto retrieve our dataset. This single line provides us with so much heavy lifting—specifically:» asynchronous retrieval of data from a URI (yes, in this first example, we’ve only specified a relative file path—but this would work just as well with a fully remote URL!)
» data-binding from the serialized JSON into a .NET object model (in this case, we’ve specified that it should be mapped into an array of typeSeriesDataModel)
» Microsoft: .GetFromJsonAsync Method
The JSON dataset that we’ve used:
- Includes dates in the
yyyy-mm-ddformat—this is intended to lessen ambiguity.» This means we have been able to use default data-binding behavior.
» Be mindful that if we were working with different or regional formats, we may have to introduce additional date-parsing code.
Within the chart markup, we’ve used Telerik’s “Date Axis” feature.
- We’ll look at that in more detail next.
Telerik Date Axis Feature
Telerik’s Date Axis feature is an easily overlooked killer feature that makes charts vastly more useful and saves a ton of time writing code.
Briefly, we can take advantage of this feature within the component markup by:
- Specifying the
CategoryFieldattribute, located within theChartSerieselement. - We’ve specified the attribute
BaseUnit="ChartCategoryAxisBaseUnit.Fit", located within the elementChartCategoryAxis:»
ChartCategoryAxisBaseUnitis an enumeration that current acceptsFit,Milliseconds,Seconds,Minutes,Hours,Days,Weeks,MonthsandYears.
If you look at the screenshot of the chart above, we can see that the x-axis labels appear as biannual values. However, the underlying data use more granular, monthly values.
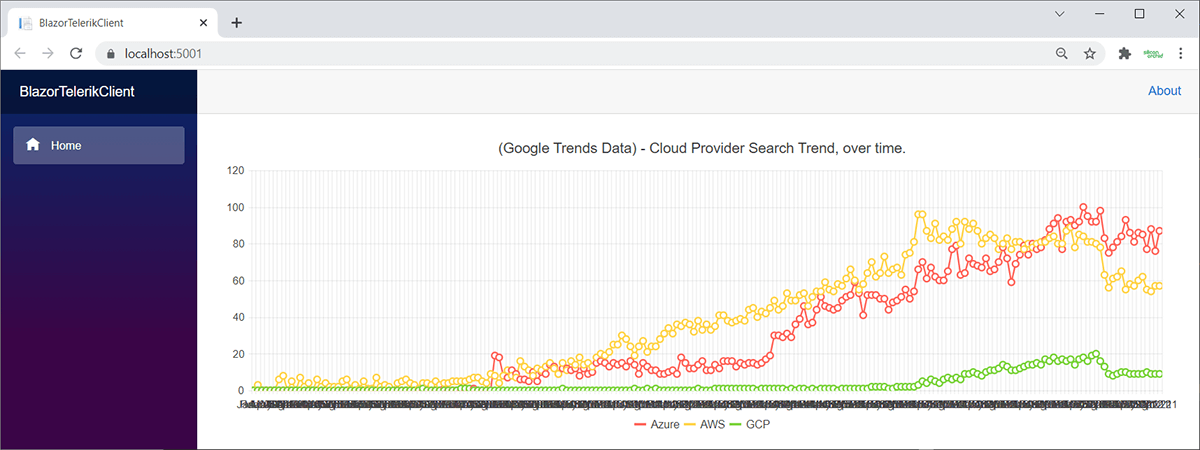
If we were to instead map our data directly from those monthly values, the x-axis headings would be extremely dense—it would be an illegible jumble, like the screenshot below:

Instead, by working with C# DateTime types, rather than just string values, the Telerik Chart component understands that it is working with dates—and it also understands the applicable range of dates (in this case
2004 through 2021).
By specifying the ChartCategoryAxisBaseUnit.Fit attribute, the component will select a range that is appropriate for the data and the available window size—in this case, it automatically selected a biannual value,
and then aggregates the dataset values to those single data points.
This may or may not be an appropriate choice.
For example, if we look more closely at the original screenshot of the chart, further up this article, we can see that data for 2021 has been truncated from the results. Furthermore, one might argue that biannual grouping no longer provides enough detail.
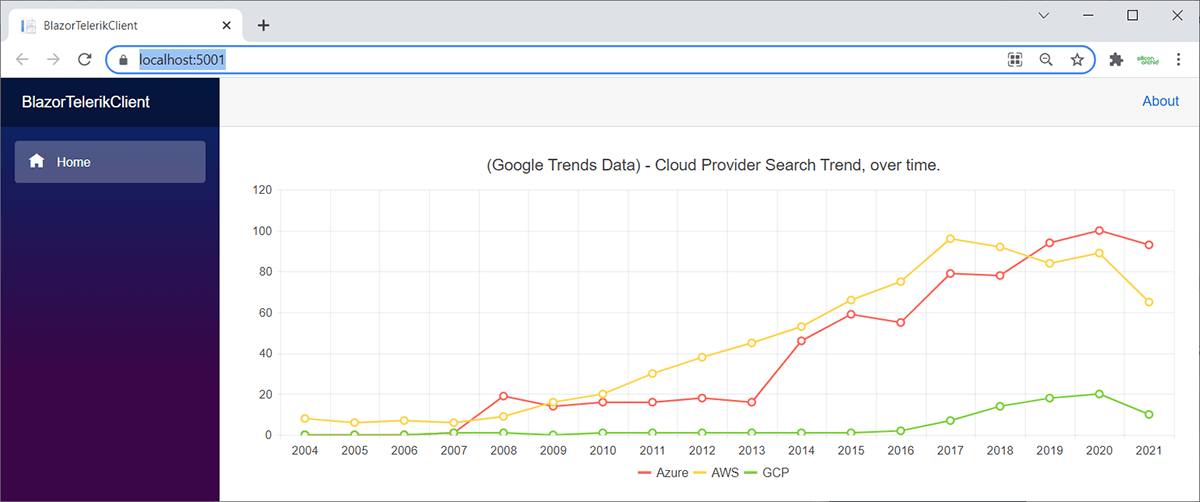
If this is the case, it may be more appropriate to specify the grouping ourselves.
For example, specifying ChartCategoryAxisBaseUnit.Years gives us a result like the following screenshot:

Debugging Tip
If you’re itching to get stuck in and adapt this tutorial, there’s a very strong chance you’ll be wanting to debug your code.
If so, there is a non-obvious gotcha related to OnInitializedAsync that’s worth knowing about.
When you start a debugging session, Blazor’s debugging proxy isn’t immediately available and takes a few moments to initialize.
A problem here is that any code in OnInitializedAsync may be executed before you get a chance to attach a debugger. You can read about this here:
A workaround is to include a few lines of code like this:
protected override async Task OnInitializedAsync()
{
    #if DEBUG
        await Task.Delay(10000);
    #endif

   // OUR CODE, AS NORMAL
}
Note: If you haven’t done so already, make sure you have the BlazorWasmDebuggingExtension installed!
Coming Up …
We’ve already mentioned that the ASP.NET CLR method Http.GetFromJsonAsync() is a versatile mechanism to load data.
In the following articles, we’ll create a selection of different cloud-based API backends. These will take advantage of the respective “serverless computing” offerings.
Because this is all HTTP-based, this means that all we need to do in our Blazor client application is literally substitute different URLs as a data source!
See you in the next articles! :-D
Go to Part 3: Azure Function, Part 4: AWS Lambda Function or Part 5: Google Cloud Functions next!
Useful References
You may find it helpful to have awareness about the following subjects. If you get stuck, here are some useful articles:
- What is Blazor?
» Microsoft: Introduction to ASP.NET Core Blazor
» Microsoft: Blazor Tutorial - What are Telerik Blazor UI components?
» Telerik: Welcome to UI for Blazor
» Telerik: Blazor Line Chart Documentation - What’s the differences between BlazorWasm and BlazorServer?
- How to use the VS Code debugger with BlazorWasm:
» Microsoft: Visual Studio Code Debugging
» Microsoft: Debug ASP.NET Core Blazor WebAssembly - What is Cross-Origin Resource Sharing (CORS)?
Acknowledgments
Thanks to Mandy Mowers & Layla Porter for the overall document review.
Disclosure
I always disclose my position, association or bias at the time of writing. As an author, I received a fee from Progress Telerik in exchange for the content found in this series of articles. I have no association with Microsoft, Amazon nor Google—this series of articles is in no way intended to offer biased opinion nor recommendation as to your eventual choice of cloud provider.

Jim McG
A UK-based freelance developer using largely Microsoft technologies, Jim McG has been working with web and backend services since the late ‘90s. Today, he generally gravitates around cloud-based solutions using C#, .NET Core and Azure, with a particular interest in serverless technologies. Most recently, he's been transitioning across to Unity and the amazing tech that is Augmented Reality.
