CandleStick Charts
RadChart has been deprecated since Q3 2014 and is no longer recommended for use, as it does not support modern browsers. We strongly recommend using RadHtmlChart, Telerik's modern client-side charting component. To transition from RadChart to RadHtmlChart, refer to the following migration articles:
Explore the RadHtmlChart documentation and online demos to determine how it fits your development needs.
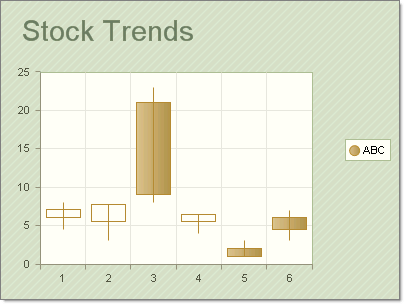
The CandleStick chart combines bar and line chart styles to show a range of value movement over time. A filled bar indicates the opening value was greater than the closing value. An empty bar indicates that the closing value was greater than the opening value. The line through the center (the "wick") shows the extreme high and low values. The meaning of the Y values in a CandleStick chart are:
-
YValue = Open
-
YValue2 = Close
-
YValue 3 = Max
-
YValue 4 = Min
The "bar" portion of each chart item is formed between the YValue and YValue2 properties. The "wick" portion of the chart is defined with the YValue3 and YValue4 chart item properties.
To create a Vertical CandleStick Chart set the SeriesOrientationproperty to Vertical. Set the RadChart DefaultType property or ChartSeries.Type to CandleStick.
To create a Horizontal CandleStick Chart set the SeriesOrientationproperty to Horizontal. Set the RadChart DefaultType property or ChartSeries.Type to CandleStick.
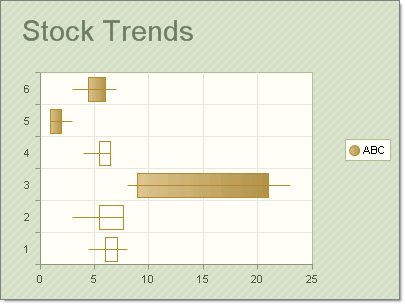
The screenshots above use the following data points:
| YValue | YValue2 | YValue3 | YValue4 |
|---|---|---|---|
| 6 | 7.1 | 4.5 | 8 |
| 5.5 | 7.7 | 3 | 6 |
| 21 | 9 | 8 | 23 |
| 5.5 | 6.5 | 4 | 6.5 |
| 6 | 4.5 | 3 | 7 |