Multiple Chart Types in a Single Chart
RadChart has been deprecated since Q3 2014 and is no longer recommended for use, as it does not support modern browsers. We strongly recommend using RadHtmlChart, Telerik's modern client-side charting component. To transition from RadChart to RadHtmlChart, refer to the following migration articles:
Explore the RadHtmlChart documentation and online demos to determine how it fits your development needs.
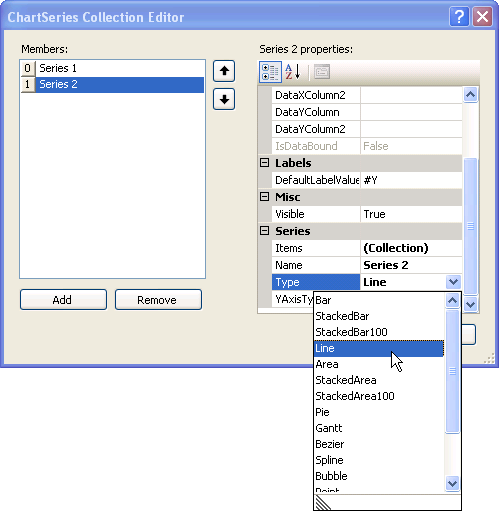
RadChart allows you to combine several chart types in a single chart. You can use the ChartSeries Collection Editor at design-time to create the ChartSeries and set the respective ChartSeriesType. You can also add chart series and set chart type programmatically.
To designate dissimilar chart types in a single chart at design time, click on a series, then select the Type property from the drop down list.
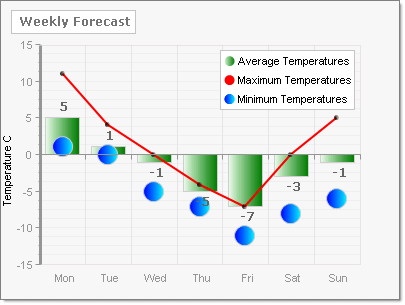
To assign chart types to a series at run-time programmatically you can pass the ChartSeriesType in the constructor or assign the ChartSeriesType after the series is constructed.The example below passes three chart series types to the constructor.
ChartSeries chartSeries =
 new ChartSeries("Average Temperatures", ChartSeriesType.Bar);
ChartSeries chartSeries2 =
 new ChartSeries("Maximum Temperatures", ChartSeriesType.Line);
ChartSeries chartSeries3 =
new ChartSeries("Minimum Temperatures", ChartSeriesType.Bubble); Use the Axis.Range property to set minimum values, maximum values and step amount for each axis. The screen shot below shows three chart series types in the same chart. See below for the full source.
RadChart radChart = new RadChart();
radChart.PlotArea.Appearance.Dimensions.Margins.Right =
Telerik.Charting.Styles.Unit.Percentage(10);
radChart.Legend.Appearance.Position.Auto = false;
radChart.Legend.Appearance.Position.X = 220;
radChart.Legend.Appearance.Position.Y = 50;
radChart.ChartTitle.Appearance.Position.AlignedPosition =
Telerik.Charting.Styles.AlignedPositions.TopLeft;
radChart.ChartTitle.TextBlock.Text = "Weekly Forecast";
radChart.ChartTitle.TextBlock.Appearance.TextProperties.Font =
new System.Drawing.Font("Verdana", 9, System.Drawing.FontStyle.Bold);
radChart.PlotArea.XAxis.AutoScale = false;
radChart.PlotArea.XAxis.AddRange(1, 7, 1);
radChart.PlotArea.XAxis[0].TextBlock.Text = "Mon";
radChart.PlotArea.XAxis[1].TextBlock.Text = "Tue";
radChart.PlotArea.XAxis[2].TextBlock.Text = "Wed";
radChart.PlotArea.XAxis[3].TextBlock.Text = "Thu";
radChart.PlotArea.XAxis[4].TextBlock.Text = "Fri";
radChart.PlotArea.XAxis[5].TextBlock.Text = "Sat";
radChart.PlotArea.XAxis[6].TextBlock.Text = "Sun";
radChart.PlotArea.XAxis.IsZeroBased = false;
radChart.PlotArea.YAxis.AxisMode = ChartYAxisMode.Extended;
radChart.PlotArea.YAxis.AxisLabel.TextBlock.Text = "Temperature C";
radChart.PlotArea.YAxis.Appearance.Width = 3;
// Create the series and assign the ChartSeriesType
ChartSeries chartSeries =
new ChartSeries("Average Temperatures", ChartSeriesType.Bar);
chartSeries.Appearance.TextAppearance.TextProperties.Font =
new System.Drawing.Font("Verdana", 9, System.Drawing.FontStyle.Bold);
chartSeries.Appearance.FillStyle.MainColor =
System.Drawing.Color.Honeydew;
chartSeries.Appearance.FillStyle.SecondColor =
System.Drawing.Color.Green;
// Define the items in the series
chartSeries.AddItem(5);
chartSeries.AddItem(1);
chartSeries.AddItem(-1);
chartSeries.AddItem(-5);
chartSeries.AddItem(-7);
chartSeries.AddItem(-3);
chartSeries.AddItem(-1);
// Create the series and assign the ChartSeriesType
ChartSeries chartSeries2 =
new ChartSeries("Maximum Temperatures", ChartSeriesType.Line);
chartSeries2.Appearance.LabelAppearance.Visible = false;
chartSeries2.Appearance.LineSeriesAppearance.Color =
System.Drawing.Color.Red;
// Define the items in the series
chartSeries2.AddItem(11);
chartSeries2.AddItem(4);
chartSeries2.AddItem(0);
chartSeries2.AddItem(-4);
chartSeries2.AddItem(-7);
chartSeries2.AddItem(0);
chartSeries2.AddItem(5);
// visually enhance the data points
chartSeries2.Appearance.PointMark.Dimensions.Width = 5;
chartSeries2.Appearance.PointMark.Dimensions.Height = 5;
chartSeries2.Appearance.PointMark.FillStyle.MainColor =
System.Drawing.Color.Black;
chartSeries2.Appearance.PointMark.Visible = true;
// Create the series and assign the ChartSeriesType
ChartSeries chartSeries3 =
new ChartSeries("Minimum Temperatures", ChartSeriesType.Bubble);
chartSeries3.Appearance.LabelAppearance.Visible = false;
chartSeries3.Appearance.FillStyle.MainColor = System.Drawing.Color.Blue;
chartSeries3.Appearance.FillStyle.SecondColor = System.Drawing.Color.Aqua;
// Define the items in the series
chartSeries3.AddItem(1);
chartSeries3.AddItem(0);
chartSeries3.AddItem(-5);
chartSeries3.AddItem(-7);
chartSeries3.AddItem(-11);
chartSeries3.AddItem(-8);
chartSeries3.AddItem(-6);
// visually enhance the data points
chartSeries3.Appearance.PointMark.Dimensions.Width = 5;
chartSeries3.Appearance.PointMark.Dimensions.Height = 5;
chartSeries3.Appearance.PointMark.FillStyle.MainColor =
System.Drawing.Color.Black;
chartSeries3.Appearance.PointMark.Visible = true;
// Add the series to the chart, chart to page.
radChart.Series.Add(chartSeries);
radChart.Series.Add(chartSeries2);
radChart.Series.Add(chartSeries3);
this.Page.Controls.Add(radChart);