.NET MAUI Cartesian Chart OHLC Series
The OhlcSeries visualizes financial data, such as stock prices, as Open-High-Low-Close (OHLC) bars.
The OHLC Series operates with a special data in the form of four parameters defining the stock market—open, high, low, and close.
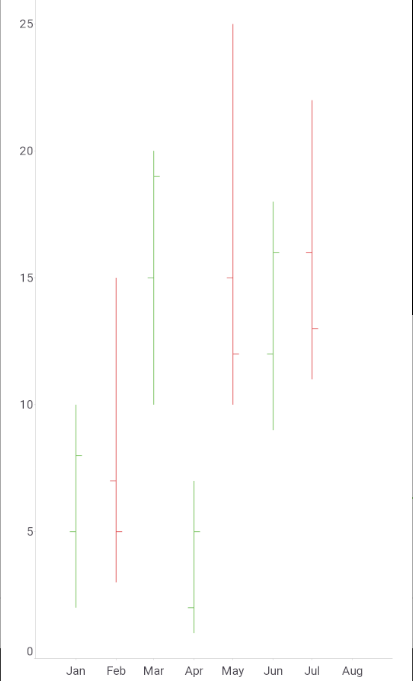
Each data point renders as a vertical line that spans the high and low prices for a period. A left tick marks the opening price and a right tick marks the closing price.
Use the OhlcSeries when you need to show price movement over time in a compact form. For a filled-body alternative, use the Candlestick Series.
Bind the OHLC Series to Data
The OhlcSeries reads four price values and one category value from each data item. Use the following properties to bind the series:
ItemsSource(IEnumerable)—Defines the collection of data items that the series plots.HorizontalBinding(string)—Defines the name of the data-item member that provides the category, for example, a date, plotted along the horizontal axis.OpenBinding(string)—Defines the name of the data-item member that provides the opening price.HighBinding(string)—Defines the name of the data-item member that provides the highest price.LowBinding(string)—Defines the name of the data-item member that provides the lowest price.CloseBinding(string)—Defines the name of the data-item member that provides the closing price.HorizontalAxis(Telerik.Maui.Controls.Charts.ChartAxis)—Defines the horizontal axis against which the series plots the category values.VerticalAxis(Telerik.Maui.Controls.Charts.ChartAxis)—Defines the vertical axis against which the series plots the price values.
Customize the OHLC Bars
The OhlcSeries colors each data point according to its price direction. A data point is bullish when the closing price is higher than the opening price, and bearish otherwise. Use the following properties to customize the bars:
BullishStroke(Brush)—Defines the stroke of bullish data points.BearishStroke(Brush)—Defines the stroke of bearish data points.StrokeThickness(double)—Defines the thickness of the lines in device-independent units. The default value isdouble.NaN, which applies the default thickness of the chart.
The
BullishStrokeandBearishStrokeproperties support onlySolidColorBrushvalues. When a brush isnull, the series resolves it from the explicit style, the implicit style, and the theme defaults, in that order.
Example with OHLC Series
The following example shows how to define an OhlcSeries with a DateTimeAxis and a NumericalAxis.
-
Define the
OhlcSeriesand the chart definition in Extensible Application Markup Language (XAML):XAML<charts:RadCartesianChart> <charts:RadCartesianChart.BindingContext> <local:FinancialViewModel /> </charts:RadCartesianChart.BindingContext> <charts:RadCartesianChart.Axes> <charts:DateTimeAxis LabelFormat="MMM" MajorStepUnit="Month" /> <charts:NumericalAxis Location="Left" /> </charts:RadCartesianChart.Axes> <charts:RadCartesianChart.Series> <charts:OhlcSeries HorizontalBinding="Category" OpenBinding="Open" HighBinding="High" LowBinding="Low" CloseBinding="Close" ItemsSource="{Binding Data}" /> </charts:RadCartesianChart.Series> </charts:RadCartesianChart> -
Add the
chartsnamespace:XAMLxmlns:charts="clr-namespace:Telerik.Maui.Controls.Charts;assembly=Telerik.Maui.Controls" -
Add the data model that exposes the
Category,Open,High,Low, andCloseproperties:C#public class OhlcDataPoint : NotifyPropertyChangedBase { private DateTime category; private double open; private double high; private double low; private double close; public DateTime Category { get { return this.category; } set { if (value != this.category) { this.category = value; this.OnPropertyChanged(); } } } public double Open { get { return this.open; } set { if (value != this.open) { this.open = value; this.OnPropertyChanged(); } } } public double High { get { return this.high; } set { if (value != this.high) { this.high = value; this.OnPropertyChanged(); } } } public double Low { get { return this.low; } set { if (value != this.low) { this.low = value; this.OnPropertyChanged(); } } } public double Close { get { return this.close; } set { if (value != this.close) { this.close = value; this.OnPropertyChanged(); } } } } -
Add the
ViewModelthat populates the data collection:C#public class FinancialViewModel { public FinancialViewModel() { this.Data = new ObservableCollection<OhlcDataPoint> { new OhlcDataPoint { Category = new DateTime(2024, 1, 1), Open = 5, High = 10, Low = 2, Close = 8 }, new OhlcDataPoint { Category = new DateTime(2024, 2, 1), Open = 7, High = 15, Low = 3, Close = 5 }, new OhlcDataPoint { Category = new DateTime(2024, 3, 1), Open = 15, High = 20, Low = 10, Close = 19 }, new OhlcDataPoint { Category = new DateTime(2024, 4, 1), Open = 2, High = 7, Low = 1, Close = 5 }, new OhlcDataPoint { Category = new DateTime(2024, 5, 1), Open = 15, High = 25, Low = 10, Close = 12 }, new OhlcDataPoint { Category = new DateTime(2024, 6, 1), Open = 12, High = 18, Low = 9, Close = 16 }, new OhlcDataPoint { Category = new DateTime(2024, 7, 1), Open = 16, High = 22, Low = 11, Close = 13 }, }; } public ObservableCollection<OhlcDataPoint> Data { get; } }
The following image shows the result, with monthly OHLC bars from January to July:
For a runnable example with the Cartesian Chart OHLC series, go to the SDKBrowser Demo Application and navigate to the Charts > Series category.
Known Limitations
The OhlcSeries does not support data point labels.