Inspectors Insights
The Fiddler Everywhere Inspectors section provides dedicated tabs for inspecting different types of captured traffic. The HTTP Inspector renders the HTTP Request and Response sections, which display the information for the selected HTTP(S) sessions from the sessions grid. The Agent Inspector is a dedicated inspector for LLM/agent sessions that surfaces cost, latency, messages, tool calls, and model configuration details. In the case where the captured traffic uses the WebSocket API or the gRPC framework, a dedicated WebSocket and gRPC inspectors tab renders, which display the connection handshake details, messages, and each message details. For secure connections in the Live Traffic section, Fiddler Everywhere can show detailed server certificate information.
The inspectors are based on the Monaco editor and provide multiple perks, among which:
- Great performance for loading large chunks of data.
- Line IDs to quickly find and mark a specific portion of the request or response.
- Powerful search functionality that supports strings and regular expressions.
- Automatic context styling that highlights the content based on its type—for example, image renderers, HTML and XML formatters, JSON formatter, JavaScript, and more.
- A Preview inspector type that recognizes and visualizes multiple formats.
- A Raw inspector that shows the received HTTP requests/responses as is. It also allows you to encode bodies received in unreadable decoded form.
- A Copy all content to clipboard option (in the toolbar at the top-right corner) that allows you to extract information efficiently.
To load the data of a session in the Inspectors section, double-click an HTTP(S), WebSocket, or gRPC session from the Live Traffic grid.
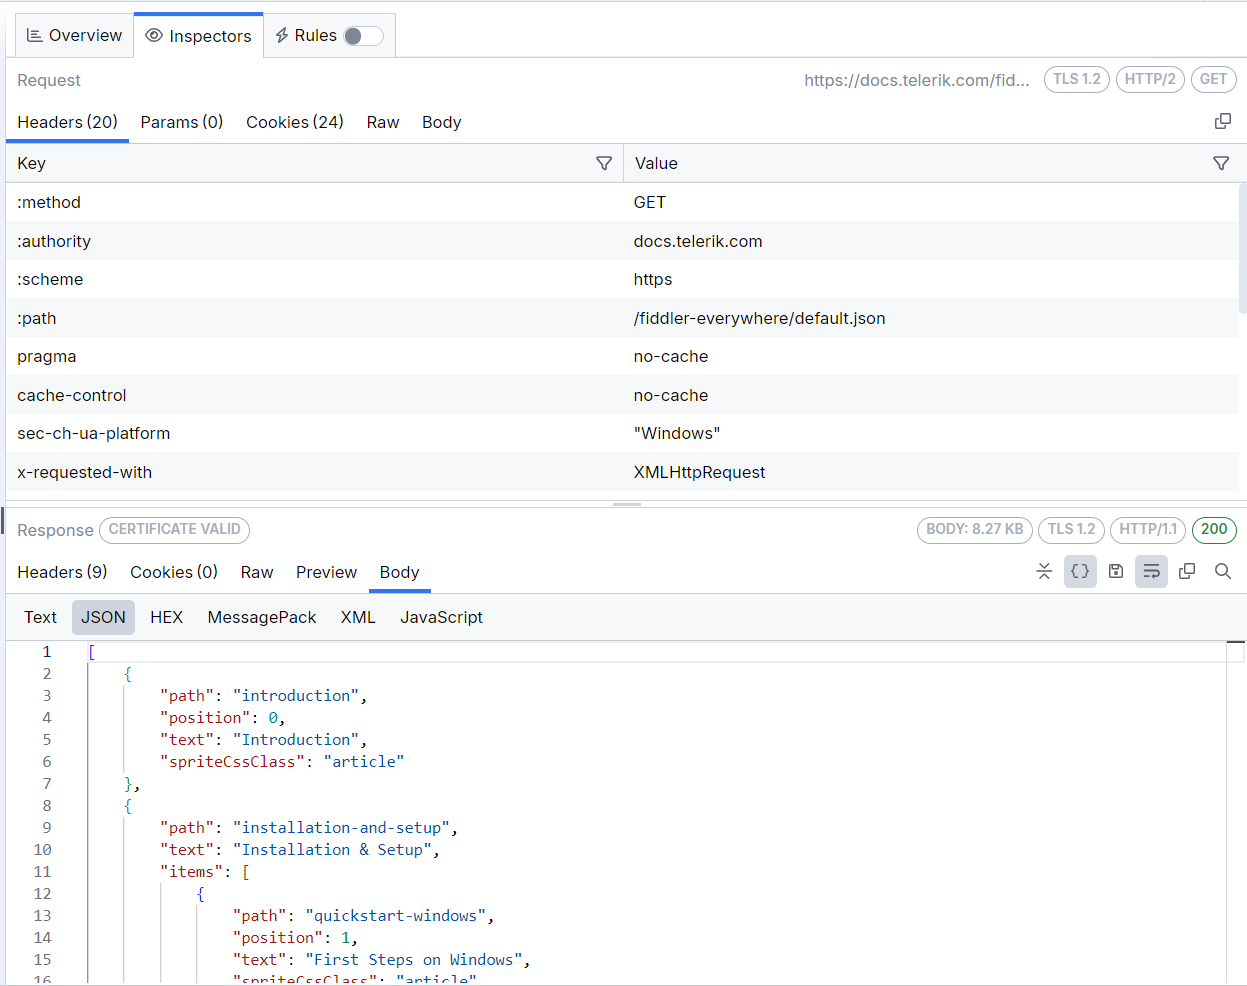
To switch the loaded name of the inspector, single-click the desired inspector name—for example, Image or Raw.
HTTP Inspector
The HTTP Inspector provides the following types of inspecting tools that enable you to examine different parts of the requests and responses:
- Headers inspector
- Params inspector
- Trailers inspector
- Cookies inspector
- Raw inspector
- Preview inspector
- Body inspector
- Auth inspector
Headers Inspector
The Headers inspector allows you to view the HTTP headers of the request and the response.
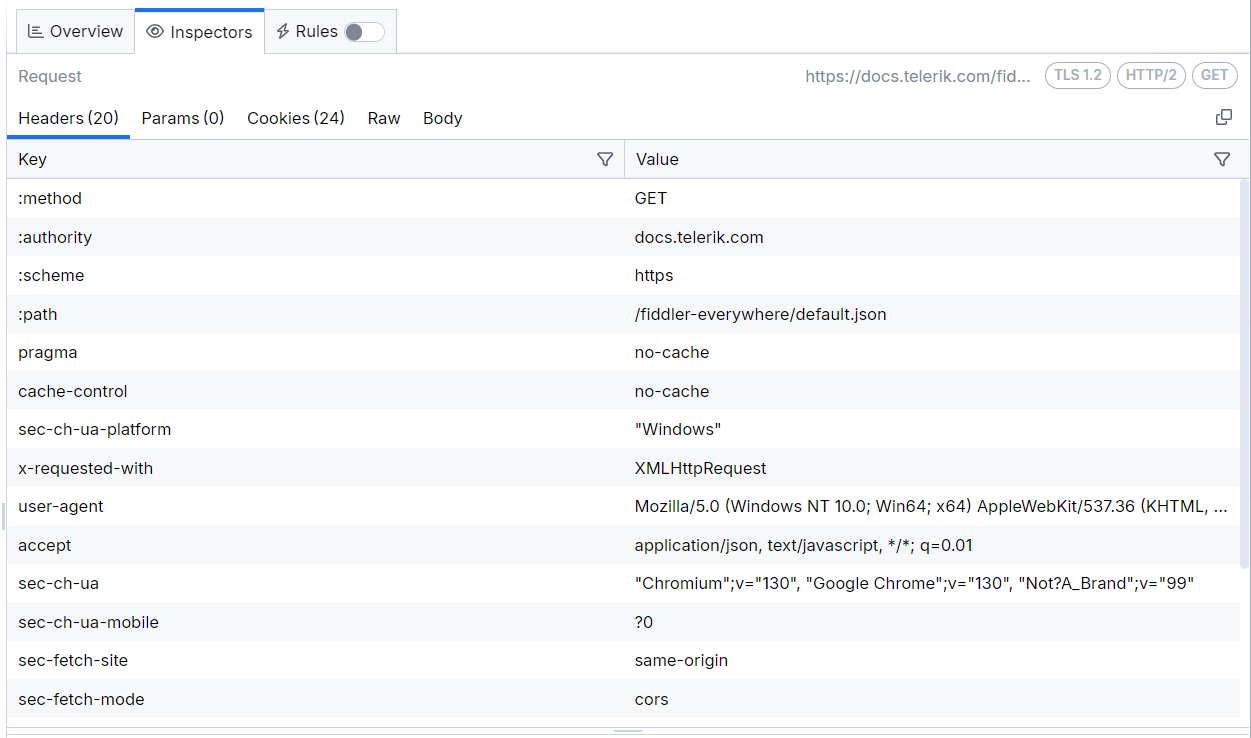
Fiddler Everywhere supports HTTP/2 and shows the HTTP/2 pseudo-headers in their original order as they are sent/received.
Params Inspector
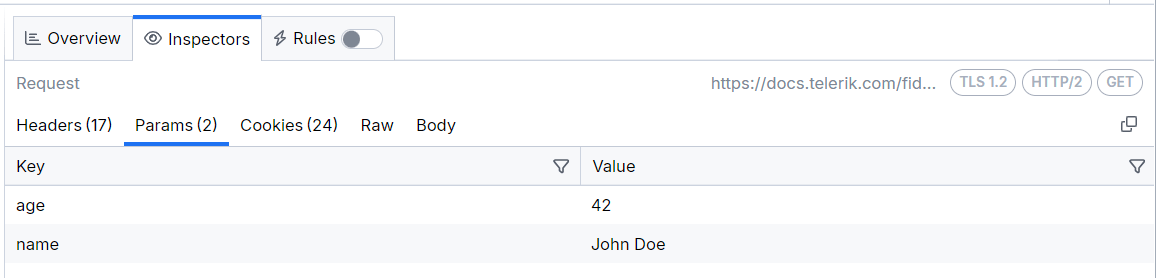
The Params inspector, available only in the Request section, displays the content from any input endpoint parameters.
Trailers Inspector
The Params inspector is a gRPC-specific inspector that helps inspect gRPC server trailer headers. Learn more about gRPC capturing here....
Cookies Inspector
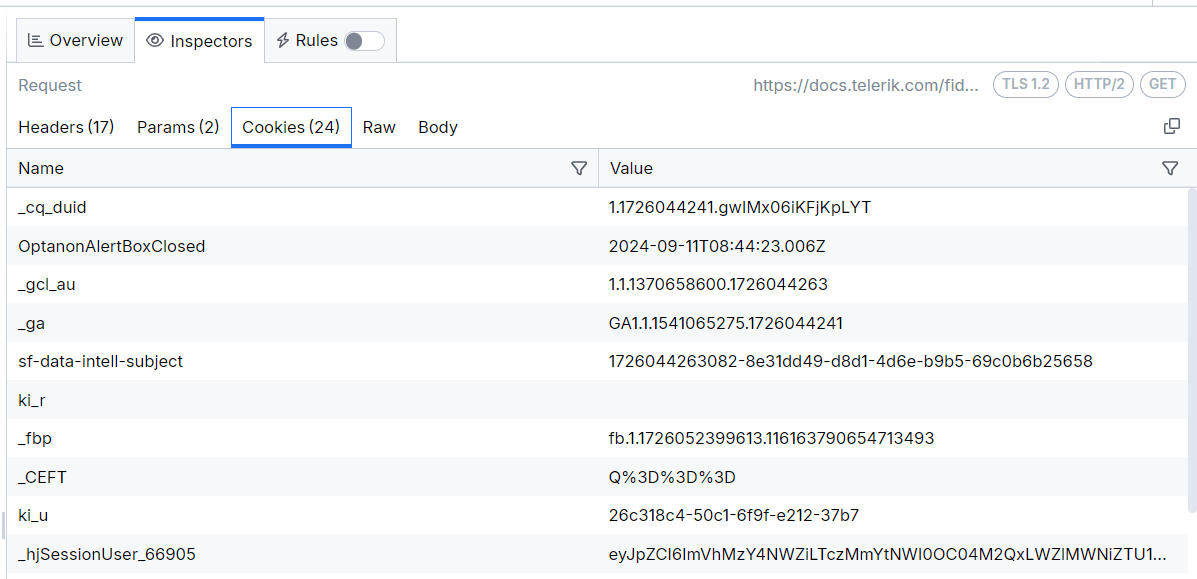
The Cookies inspector displays the contents of any outbound Cookie and Cookie2 request headers and any inbound Set-Cookie, Set-Cookie2, and P3P response headers.
Raw Inspector
The Raw Inspector allows you to view the complete request and response, including headers and bodies, as text. Most of the inspector represents a large text area that displays the body text interpreted using the detected character set with the headers, the byte-order-marker, or an embedded META tag declaration.
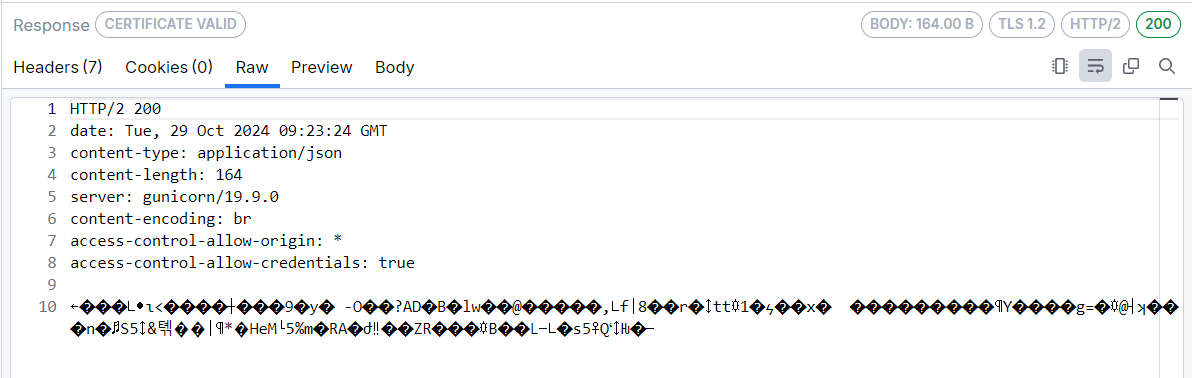
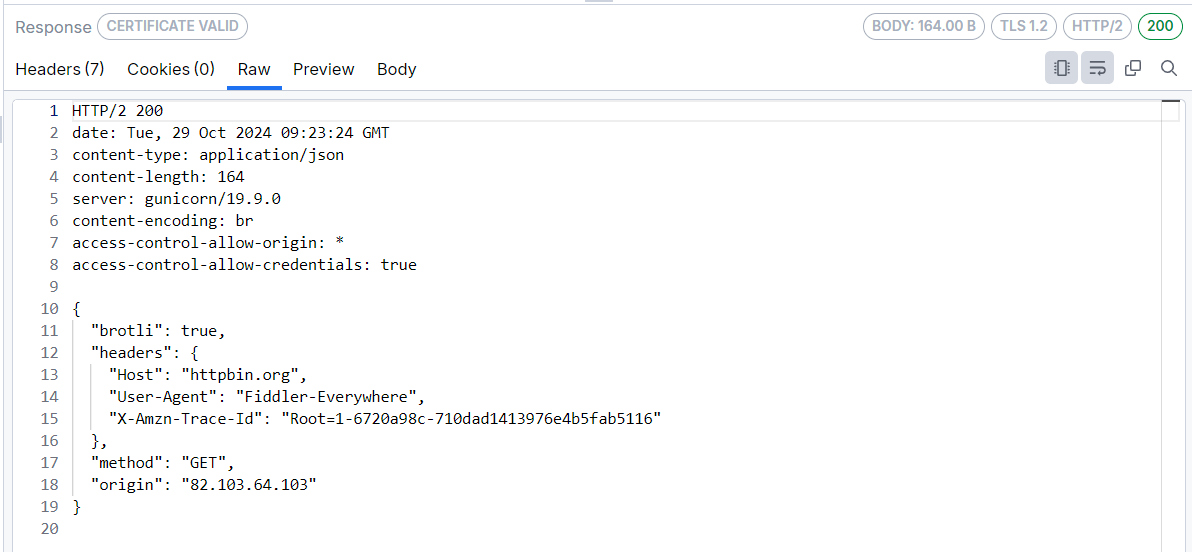
By default, the request or response displays as received, which means that encoded or compressed content will be in a non-human readable format and displayed as is. The Raw Inspector comes with a special decode button (located in the toolbar), decoding encoded content.
The following figure displays the encoded raw content with the decode button in an inactive state.
The following figure displays decoded raw content with the decode button in an active state.
Request Raw Inspector Details
Every HTTP(S) request begins with plain text headers that describe what the client requests as a resource or operation. The first line of the request (the Request line) contains the following values:
- The HTTP method—For example, GET.
- The URL path which is being requested—For example,
/index.html. - The HTTP version—For example,
HTTP/1.1.
The Request line can consist of one or more headers listed in rows that contain name-value pairs of metadata about the request and the client, such as the User-Agent and Accept-Language.
The Request body (if such exists) appears at the bottom and is separated by an empty line from the last header.
Response Raw Inspector Details
Like the HTTP request, every response begins with plain text headers describing the request's result. The first line of the response (the Status line) contains the following values:
- The HTTP version—For example,
HTTP/1.1. - The response status code—For example,
200. - The response status text—For example,
OK.
The Status line can consist of one or more headers listed in rows that contain name-value pairs of metadata about the response and the server, such as the length of the response file, the content type, and how the response can be cached.
The Response body (if such exists) appears at the bottom and is separated by an empty line from the last header.
Preview Inspector
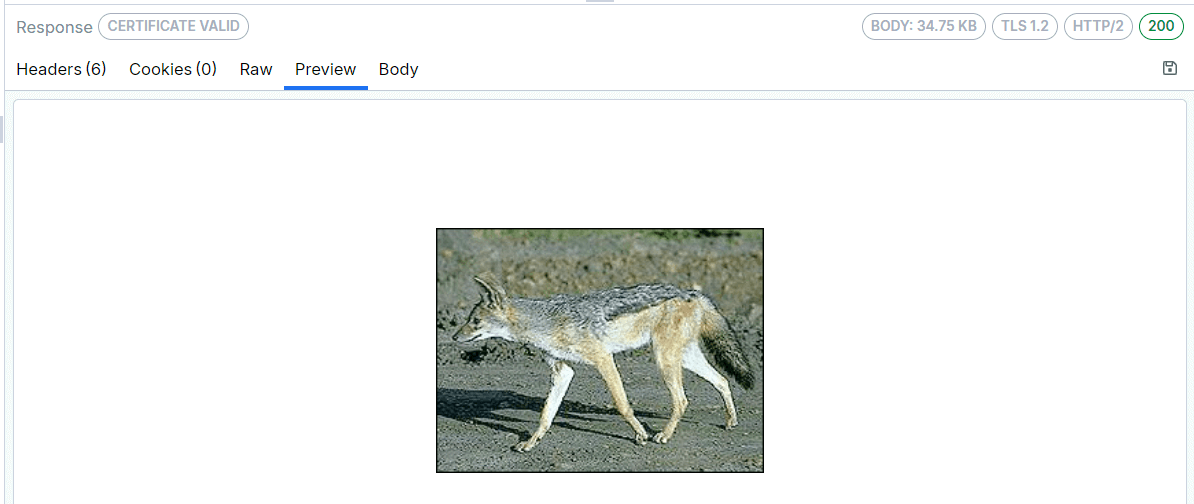
The Preview Inspector, available in the Request section only, allows you to view the response bodies as an image or an HTML page, depending on the response content. The inspector can display the most common web image formats, including JPEG, PNG, GIF, and less common formats like cursors, WebP, JPEG-XR, bitmaps, and TIFF.
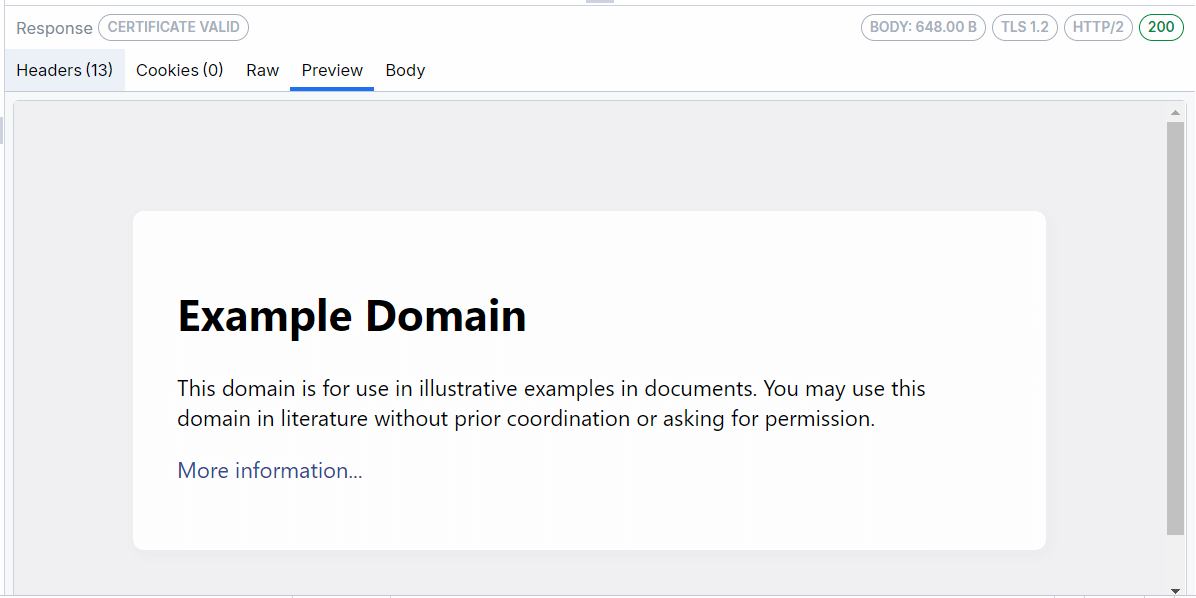
If the content is in HTML format, then the Preview inspector allows you to view responses in a web browser control, which provides a quick preview of how a given response may appear in a browser. The web browser control is configured to prevent additional downloads when rendering the response (to avoid flooding the Live Traffic grid), which means that most images and styles will not be displayed. Additionally, scripting and navigating are blocked and provide a read-only preview.
Body Inspectors
The Body inspectors are suitable for different requests and responses. Depending on the received content type, Fiddler Everywhere automatically tries to load the most appropriate body inspector. Fiddler Everywhere provides the following body inspectors:
Text Body Inspector
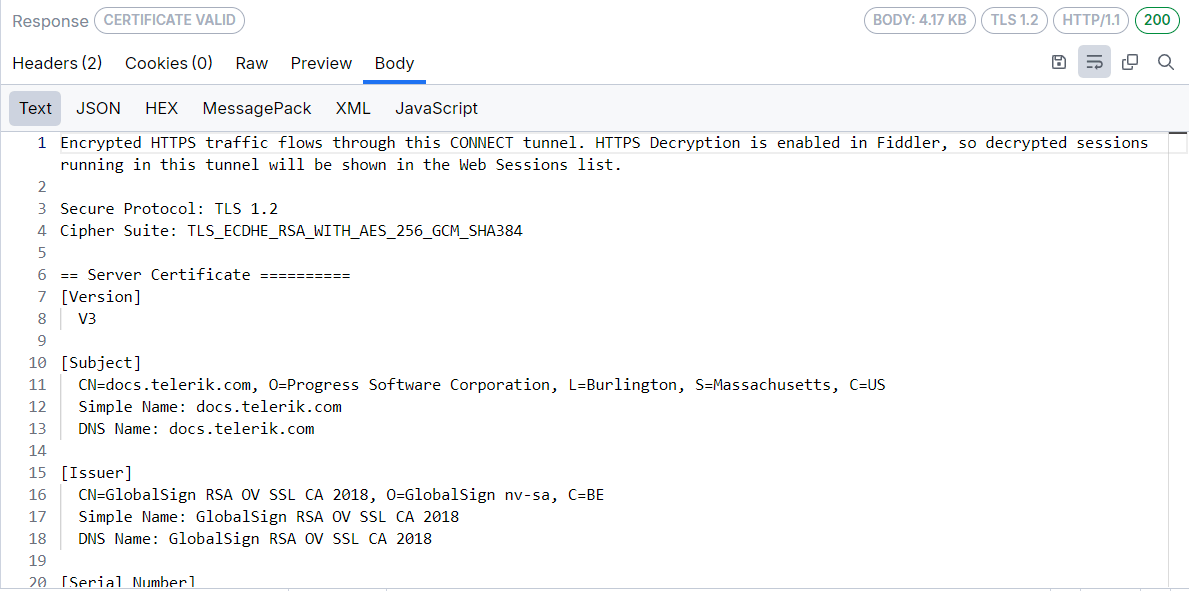
The Text inspector lets you view the request and response bodies as text. It truncates the data it renders at the first null byte it finds, making it inappropriate for displaying binary content. Most body inspectors represent a large text area that reveals the body text interpreted using the detected character set with the headers, the byte-order-marker, or an embedded META tag declaration.
JSON Body Inspector
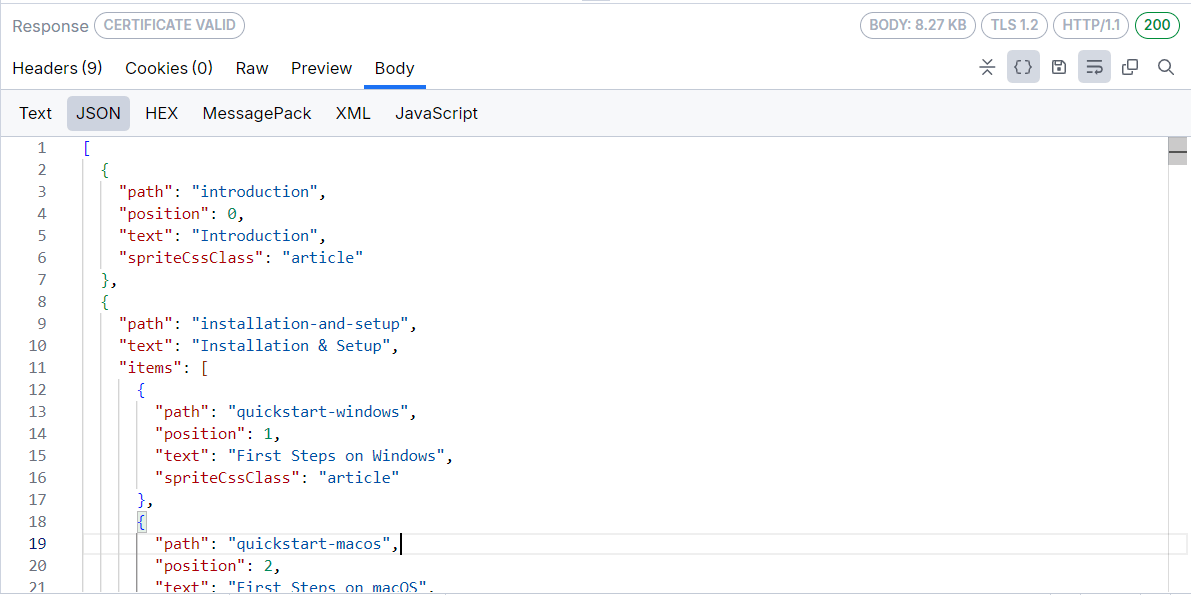
The JSON inspector interprets the selected request or response body as a JavaScript Object Notation (JSON) formatted string, showing a tree view of the JSON object nodes. The tree view will remain empty if the body cannot be interpreted as JSON. The JSON inspector can render the data even if the request or response is compressed or has HTTP chunked encoding.
If the JSON data is malformed, for example, the name component of a name/value pair is unquoted, the JSON inspector will show a warning in the footer.
HEX Body Inspector
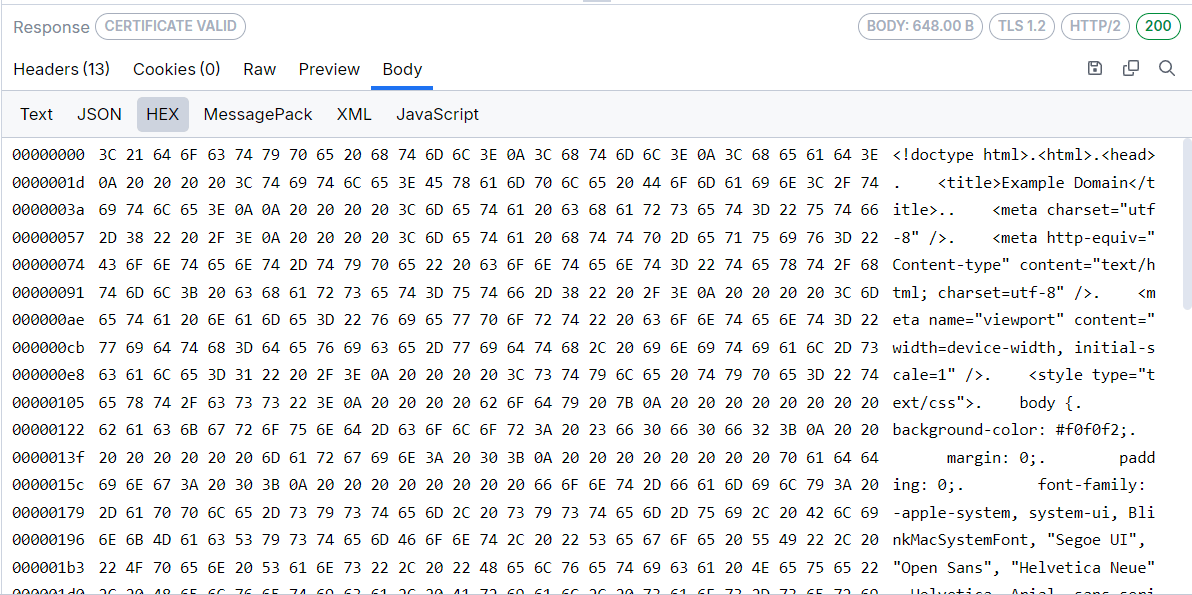
The HEX inspector loads a hex representation of the HTTP request/response bodies. The hex data can help identify hidden information in the requests/responses and find special characters (for example, CRLF, Tab, and others). The HEX inspector's primary goal is to help people analyze bodies with binary data while providing performance optimization for working with larger files.
The HEX inspector consists of an offset column, a hex view column, and a text view column.
MessagePack Body Inspector
The MessagePack inspector interprets the selected request or response body as a MessagePack, showing a tree view of the MessagePack object nodes. The MessagePack inspector tab is auto-selected, and the message contents are decoded for all cases where the Content-Type header contains the keywords messagepack or msgpack, for example, Content-Type: application/x-msgpack.
Protobuf Body Inspector
The Protobuf inspector decodes request and response bodies that use Protocol Buffers (Protobuf). The Protobuf tab was previously available only for gRPC sessions, but it is now also available for HTTPS sessions in Live Traffic when the selected message contains Protobuf data.
To decode Protobuf messages, add one or more .proto files through Settings > Protobuf > Decode via .proto file. If no matching schema is available, the inspector cannot decode the message and prompts you to add a .proto file.
Socket.IO Body Inspector
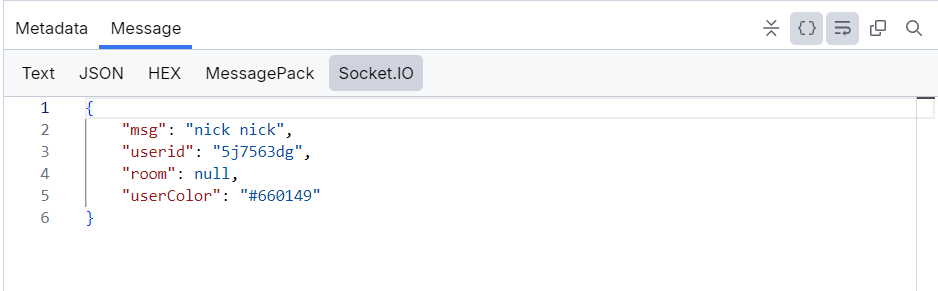
The Socket.IO inspector interprets the selected request or response body as a [Socket.IO] message data, showing a tree view of the Socket.IO object nodes.
XML Body Inspector
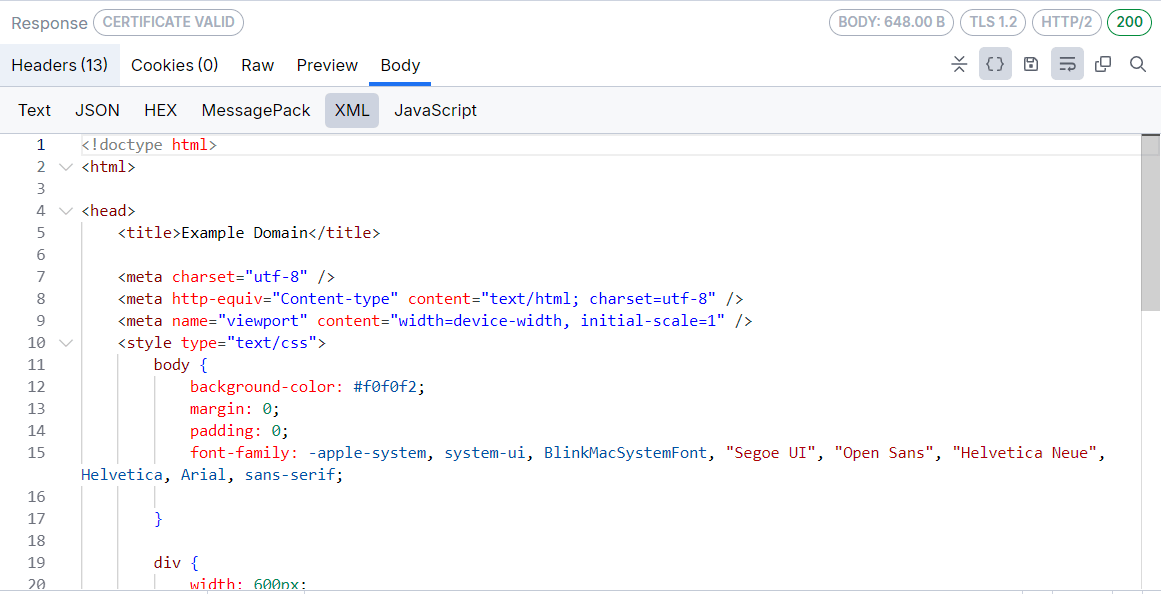
The XML inspector interprets the selected request or response body as an Extensible Markup Language (XML) document, showing a tree view of the XML document nodes. The tree view will remain empty if the body cannot be interpreted as XML (that includes valid HTML). Each XML element is represented as a node in the tree. The attributes of the element are displayed in square brackets after its name. The inspector provides an Expand All / Collapse All toggle button to expand or collapse all XML tree nodes.
Form Data Body Inspector
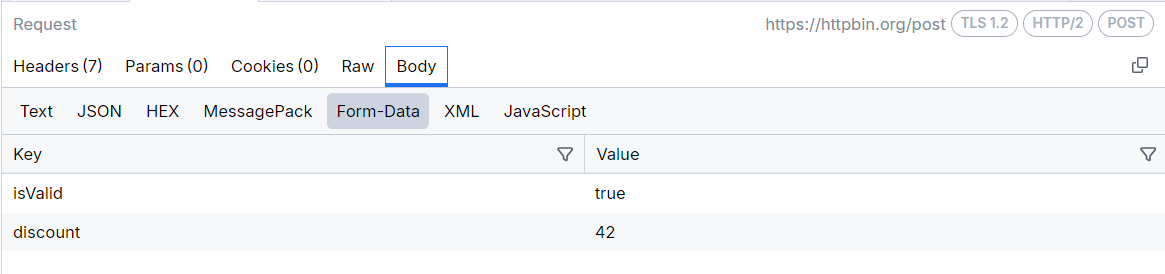
The Form Data inspector, available in the Request section only, parses the request query string and body for any HTML form data. If a form is found, the parsed name/value pairs are displayed in the grid view. The inspector works best with application/x-www-form-urlencoded data used by most simple web forms.
JavaScript Body Inspector
The JavaScript inspector interprets and formats the selected request or response body as a JavaScript/TypeScript code. The inspector will recognize and properly format the following MIME types:
application/ecmascript
application/javascript
application/x-ecmascript
application/x-javascript
text/ecmascript
text/javascript
text/javascript1.0
text/javascript1.1
text/javascript1.2
text/javascript1.3
text/javascript1.4
text/javascript1.5
text/x-ecmascript
text/x-javascript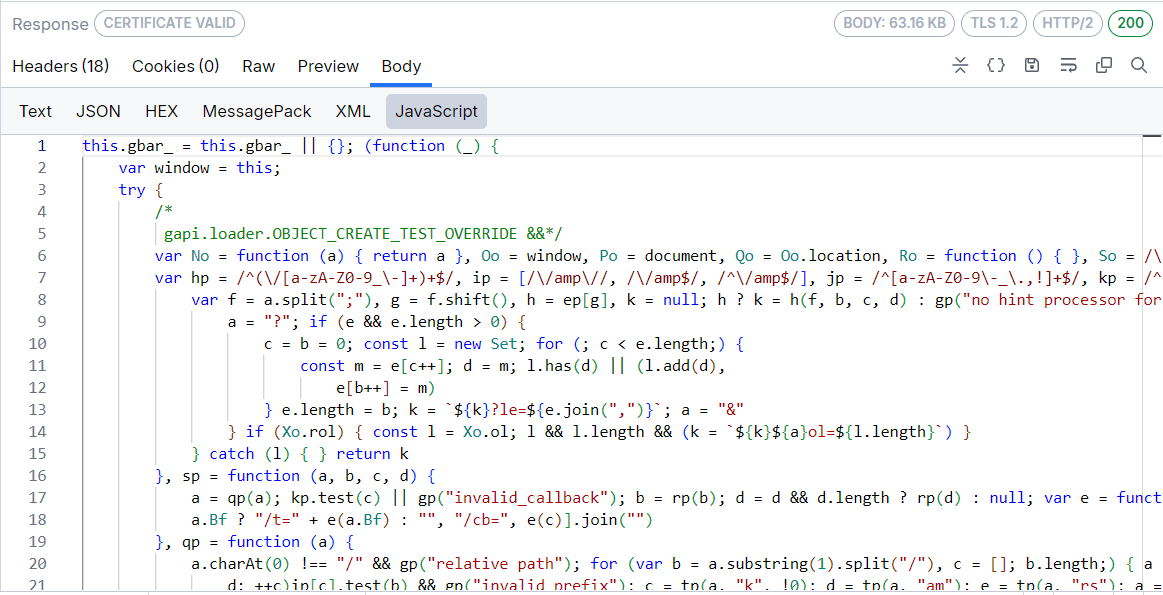
Auth Inspector
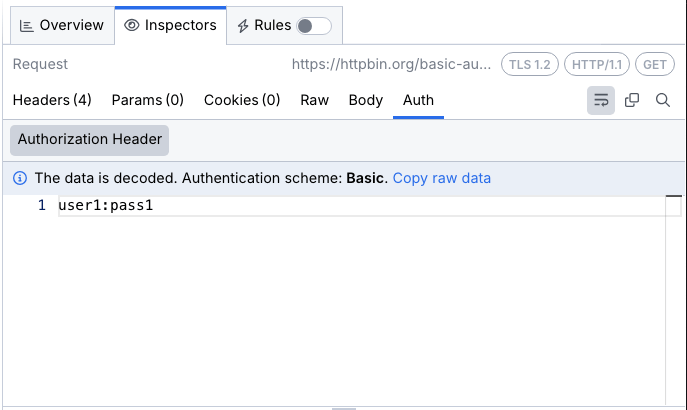
The Auth inspector obtains authorization information from the Authorize and Proxy-Authorize headers and from SAML requests and responses within their query parameters and Request bodies, then tries to decode this information if possible. Fiddler recognizes the Basic auth scheme and JWT Bearer tokens as authorization headers.
Agent Inspector
The Agent Inspector is a dedicated inspector for LLM/agent sessions. It appears alongside the HTTP Inspector tab and is available when inspecting sessions in the Live Traffic grid, the Agent Calls section, and saved snapshots. When an agent session (such as an API call to an LLM provider) is selected from the Agent Calls section, the Agent Inspector is shown as the default inspector. When the same session is selected from the Live Traffic grid, the Agent Inspector appears as an additional tab next to HTTP Inspector.
The Agent Inspector provides the following sub-tabs:
Cost Sub-Tab
The Cost sub-tab provides a token usage and cost breakdown for the selected session. The tab contains two collapsible sections:
- Tokens Count—Displays the number of input tokens, output tokens, and total tokens consumed by the request, along with each value's percentage share of the total.
- Cost—Displays the monetary cost for input tokens, output tokens, and the total cost of the call, along with each value's percentage share of the total.
When a session is served from the Fiddler Everywhere Agent Cache, the Cost sub-tab also shows a cache-hit banner indicating how many tokens and how much money the cached response saved (for example, "Cache hit. This call saved ~$0.0003 (331 tokens)."). In this case, a note below the banner states that the metrics shown are from the cached session.
Latency Sub-Tab
The Latency sub-tab shows the response time for the selected session. When a session is served from the Fiddler Everywhere Agent Cache, the tab shows a cache-hit banner indicating how many seconds of latency were avoided by serving the cached response (for example, "Cache hit. This call avoided ~2.88 s latency.").
Messages Sub-Tab
The Messages sub-tab renders the full conversation exchange of the selected session in a readable, chat-style view. Messages are presented by role:
- User—Displays the user prompt and any additional context or data passed to the model.
- Agent—Displays the model's response to the user prompt.
- Tool Call—Displays a tool call made by the agent during the session.
- Tool Response—Displays the response returned by the tool.
A filter icon in the top-right corner of the sub-tab allows you to filter the displayed messages.
Tools Sub-Tab
The Tools sub-tab displays all tools available to the model and any tool calls made during the session. The number of detected tool calls is indicated directly in the sub-tab label (for example, Tools (0) when no tool calls are detected). The sub-tab provides two views:
- Usage—Shows each available tool and the number of times it was called during the session. When no tool calls are present, the view displays the message "No tool calls detected in this session."
- JSON—Displays the full definitions of all available tools in JSON format, including their names, descriptions, and parameters.
Model Sub-Tab
The Model sub-tab displays the model configuration details for the selected session. It provides the following collapsible sections:
- Model Configuration—Shows model parameters for the session. The available parameters vary depending on what was included in the LLM request. Common parameters include Provider (the service provider, for example
OpenAI), Model (the model version, for examplegpt-4.1-mini-2025-04-14), Stream (whether streaming was enabled), and Thinking Tokens Used (whether extended thinking tokens were consumed). Additional parameters such as Max Tokens may appear when specified in the request. - System Prompt—Displays the system prompt passed to the model for the session (for example, "Summarize hotel options. Be helpful and confident.").
WebSocket, gRPC, SSE, and SocketIO Inspectors
Fiddler Everywhere provides common user interface to create inspectors for visualizing WebSocket, gRPC, Server-Sent Events, and Socket.IO traffic. The inspectors provide the following types of inspecting tools that enable you to examine different parts of a connection:
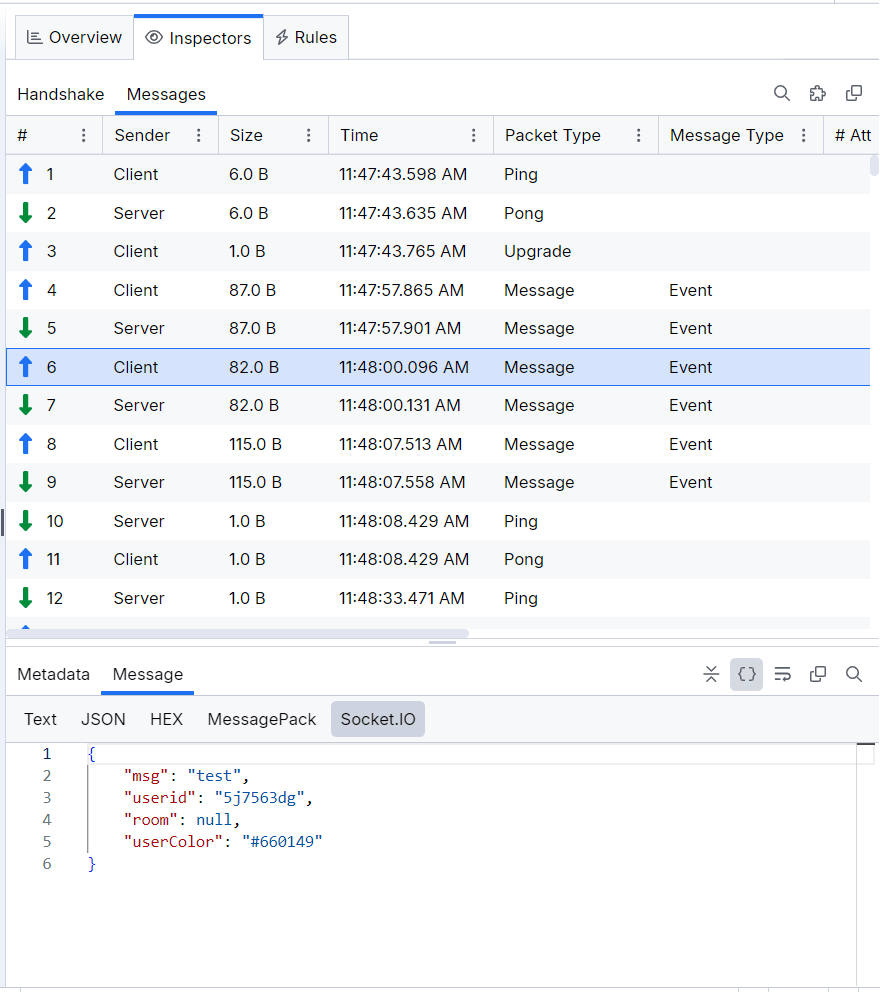
Encoded messages from a gRPC session are automatically decoded (if possible) and presented in human-readable form in the inspector. Fiddler will try to automatically decode captured gRPC sessions through a known decoding mechanism, server reflection (if such is present on the server side), or through a Protobuf file. Users can add one or more Protobuf files through the Settings > Protobuf > Decode via .proto file option.
The same Protobuf decoding capabilities are also available for HTTPS sessions through the Body > Protobuf tab in Live Traffic.
Learn more about capturing gRPC traffic with Fiddler Everywhere here...
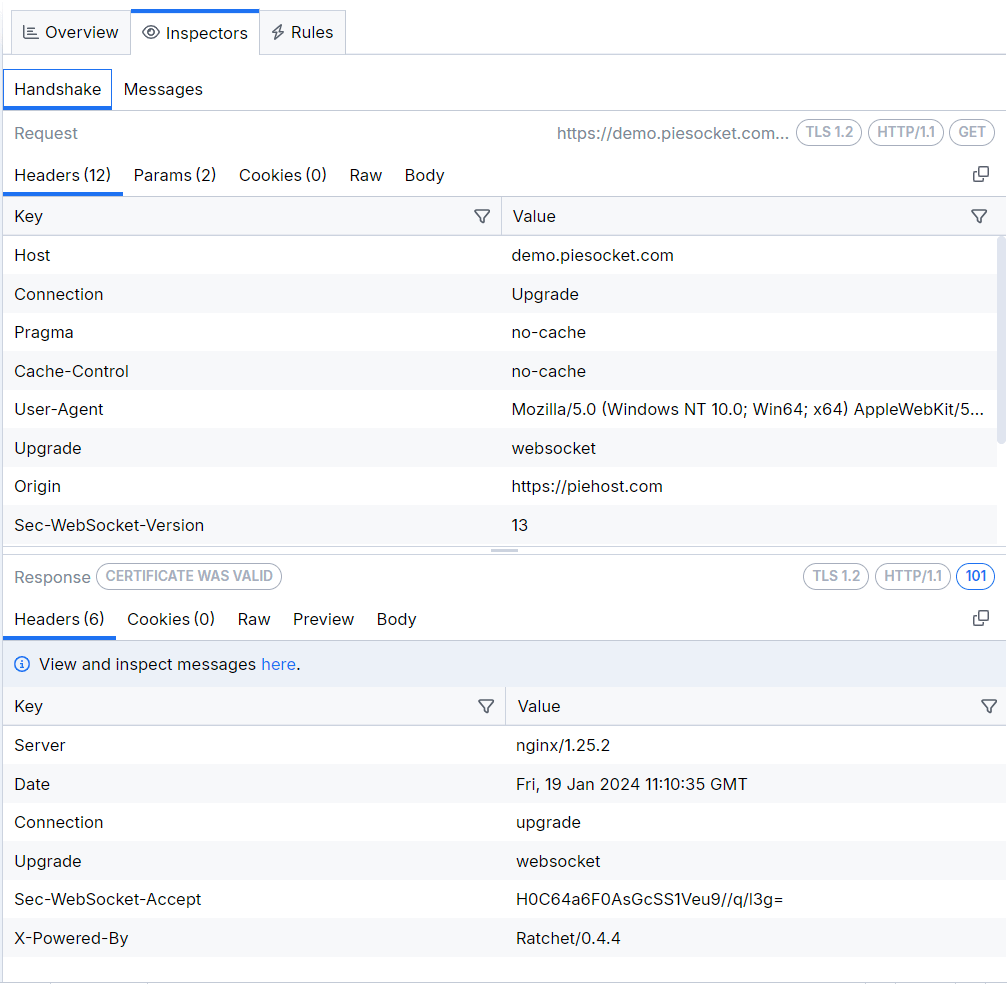
Handshake Tab
Similarly to an HTTP(S) request and response, the Handshake tab for the WebSocket and gRPC APIs provide the following types of inspecting tools that enable you to examine different parts of the WebSocket requests and responses:
Messages Tab
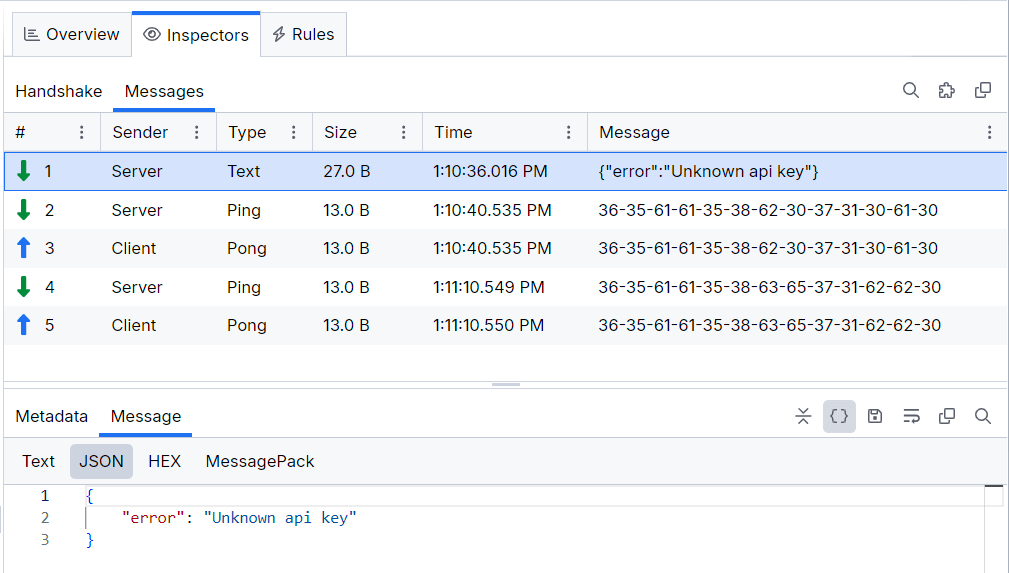
The Messages tab renders a list of the WebSocket or gRPC messages sent from the client or received from the server. The list is constantly populated with new upcoming messages until the two-way communication is disconnected. Each received WebSocket message can be inspected separately through the Metadata inspector and through the Message Inspector.
The list of messages is rendered as a grid with multiple columns:
- #—Number indicating the consecutive number of the message.
- Sender—Indicates whether the Client or Server sent the message.
- Type (WebSocket only)—Indicates the type of the message. The supported values are as follows:
- Size—The length of the message in bytes.
- ID (SSE and Socket.IO)—The ID for the specific SSE message (if such exists).
- Sender (gRPC, Socket.IO)—Indicates whether the sender is the client or the server application.
- Event (SSE only)—The server-sent event name which corresponds to Type column in Google Chrome’s DevTools.
- Data (SSE, Socket.IO)—Contains the value of the data property of the message.
- Raw (SSE only)—Contains the whole object sent from the server without any parsing.
- Time (WebSocket, SSE, Socket.IO)—Renders the date and the time when the message is received.
- Message—The string representation of the message sent/received.
- Packet Type (Socket.IO only)—Indicates the type of the received Socket.IO packet (for example, Ping, Pong, Upgrade, Message).
- Message Type (Socket.IO only)—Indicates the type of the received Socket.IO message (for example, Event).
- Attachments (Socket.IO only)—Lists the included attachments (if present).
- Namespace (Socket.IO only)—Lists the included namespace (if present).
- Message Type (Socket.IO only)—Indicates the type of the received Socket.IO message (for example, Event).
- Ack.ID (Socket.IO only)—Indicates the ID of the acknowledgment function (if present).
Messages Toolbar
The top-right corner of the Messages tab contains a toolbar with the following functionalities:
- Search (WebSocket only) field to filter received WebSocket messages.
- Unfragment all messages (WebSocket only) button to combine all continuation type messages with their original message and remove them from the Messages list.
- Copy all content to clipboard button that immediately puts all captured messages into the operating system clipboard.
Metadata inspector
The Metadata inspector (available only for WebSocket traffic) contains timestamps and masking information about the selected WebSocket message.
- DoneRead—Indicates when the Client/Server finished processing the message.
- BeginSend—Indicates when the Client/Server sent the message.
- DoneSend—Indicates when the Client/Server finished sending the message.
- Data masked by key—The key that conceals the message.
Message Inspector
The Message Inspector contains the non-masked message content visualized in Text, JSON (WebSocket only), or HEX body inspector. The inspector has a toolbar that allows you to word-wrap the message content and highlight content through a search term.
Context Menu
All inspectors provide further interaction options through a context menu. The context menu options vary depending on the inspectors' type (refer to the list below).
- Copy—Basic copy operation for selected content. Available in most inspectors.
- Copy Value—An option to copy only the value (from a key-value pair). Available in Headers inspector.
- Copy Key/Value—An option to copy the key-value pair. Available in Headers inspector.
- Copy Response Cookie Value—An option to copy the value of a selected cookie. Available in Cookies inspector.
- Decode Value—An option that allows you to decode selected value. The decode option supports built-in decoding of Base64, EscapedSequences, Encoded URL, Hex, and Encoded HTML. Available in Headers, Form Data and Cookies inspectors.
- Decode Selection—An option that allows you to decode selected content (encoded). The decode option supports built-in decoding of Base64, EscapedSequences, Encoded URL, Hex, and Encoded HTML. Available in Raw inspector and all Body inspectors (Text, JSON, XML, JavaScript). The Decode Selection option opens a new detached window that you can use to inspect different snapshots and sessions.
- Add as a column—An option to create a custom column in the Live Traffic grid while using the selected HTTP Header. Available in Headers inspector.
Toolbar
Each inspector has a toolbar that provides a different set of functionalities and information as follows:
- Server Certificate Details
- Badges that output the request URL (Request inspector only), the TLS version, the HTTP version, the HTTP method (Request inspector only), Body size, and the status code (Response inspector only).
- Expand All / Collapse All—Toggle to expand or collapse all the output data. Available for all Body inspectors.
- Decode / Encode—Toggle between compressed/uncompressed or decoded/encoded content. Available only for the Raw inspector.
- Reformat Text—Formats the text with the built-in Monaco editor optimizations. Available only for JSON, XML, and JavaScript inspectors.
- Save request body to file—Exports the body in the format specified as content type. Raw data is exported as DAT files. Available for the Raw and Body Request inspectors.
- Save response body to file—Exports the body in the format specified as content type. Raw data is exported as DAT files. Available for the Raw and Body Response inspectors.
- Save image to file—Exports the previewed images in the specified format. Available only for the Preview inspector.
- Toggle Word Wrap—Toogle the option to transfer a word with insufficient space from the end of one line of text to the beginning of the next.
- Copy all content to clipboard—Copies the inspector's content into the system clipboard.
Server Certificate Details
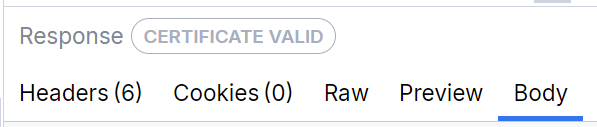
The Response Inspectors for ongoing capture (the sessions in the Live Traffic grid) in Fiddler Everywhere contain indicators and notifications that show if a server certificate is valid, expiring, or causes errors.
Learn more on how to inspect and use the certificate details with Fiddler Everywhere here...