Top 17 Tips for Effective Grids in Web Apps

Summarize with AI:
We've assembled our top tips on grids in one place to help you get the most out of the grids in your web applications. Check it out.
Grids (or grid views or datagrids) are a simple and effective way to display tables of data on a page. Lots of devs use them all the time, and they have a long history in web development. However, it's easy to use them poorly, resulting in a less than optimal user experience. As part of our mission to make the lives of developers easier, we've put together a list of tips that will help you achieve the full potential of the grids you use in your web applications.
Check out all our top 17 tips below, or head right to your favorite with our handy Table of Contents.
Table of Contents
Tip #1. Use the Right Data FormatTip #2. Support Caching for Offline Applications
Tip #3. Enable Data Virtualization
Tip #4. Support Multi-Column Sorting
Tip #5. Leverage Extensible Paging
Tip #6. Utilize Effective Databinding to Remote Data
Tip #7. Take Advantage of Push Notifications
Tip #8. Support the Exporting of Data to Multiple Formats
Tip #9. Support Both Batch-Based and Inline Editing of Data
Tip #10. Provide Type-Aware Filtering
Tip #11. Leverage Templates for Data Layout and Appearance
Tip #12. Utilize Frozen Columns for Data Navigation
Tip #13. Utilize Themes
Tip #14. Support for Responsive Design
Tip #15. Use Embedded Data Visualizations
Tip #16. Support Detail Templates
Tip #17. Use Aggregates to Provide Insights into Data
About Kendo UI and the Kendo UI Grid
Wrapping Up
Tip #1. Use the Right Data Format
Data comes in a wide variety of formats, including XML, YAML, JSON, CSV and more. Each data format has its advantages and disadvantages. A robust grid should be able to bind to data in these formats. As a side note, the task of converting data from one format to another should be avoided since it can impose a performance penalty when binding data to a grid. Therefore, it is best to bind a grid to the data in its original format if the grid supports it.
Tip #2. Support Caching for Offline Applications
It’s important to utilize caching of data that is bound to grids whenever possible. Caching can reduce or eliminate the need to issue HTTP requests and can greatly improve the overall performance and scalability of your web apps. Most of the time, HTTP caching will help as well through the response headers returned by the web server when data is requested. However, there are scenarios in which it’s useful to have grids support a local cache of data on the client itself. Offline application support is one such scenario where local caching can greatly improve the overall user experience.
Tip #3. Enable Data Virtualization
When working with a large amount of data in the grid, the task of fetching and processing this data can impose a significant runtime performance penalty due to limited browser resources. Virtualization, a technique used to mitigate slowdown stemming from operating with huge volumes of data, will display the data in the grid as it’s needed. It achieves this by displaying the items for the current page index and retrieving items on-demand. In the case of a grid being bound to data from a remote location, this includes automatically requesting data from the endpoint.

Figure 1: Grid bound to 10 million rows in less than a second (through virtualization)
Tip #4. Support Multi-Column Sorting
The ability to sort data is a core feature of grids. It enables users to quickly organize data to discover patterns and gain insights. Most grids provide primitive sorting mechanisms that operate against columns of data. Ideally, a grid should also include features like sorting against non-string types such as numeric values and dates as well as sorting across multiple columns.
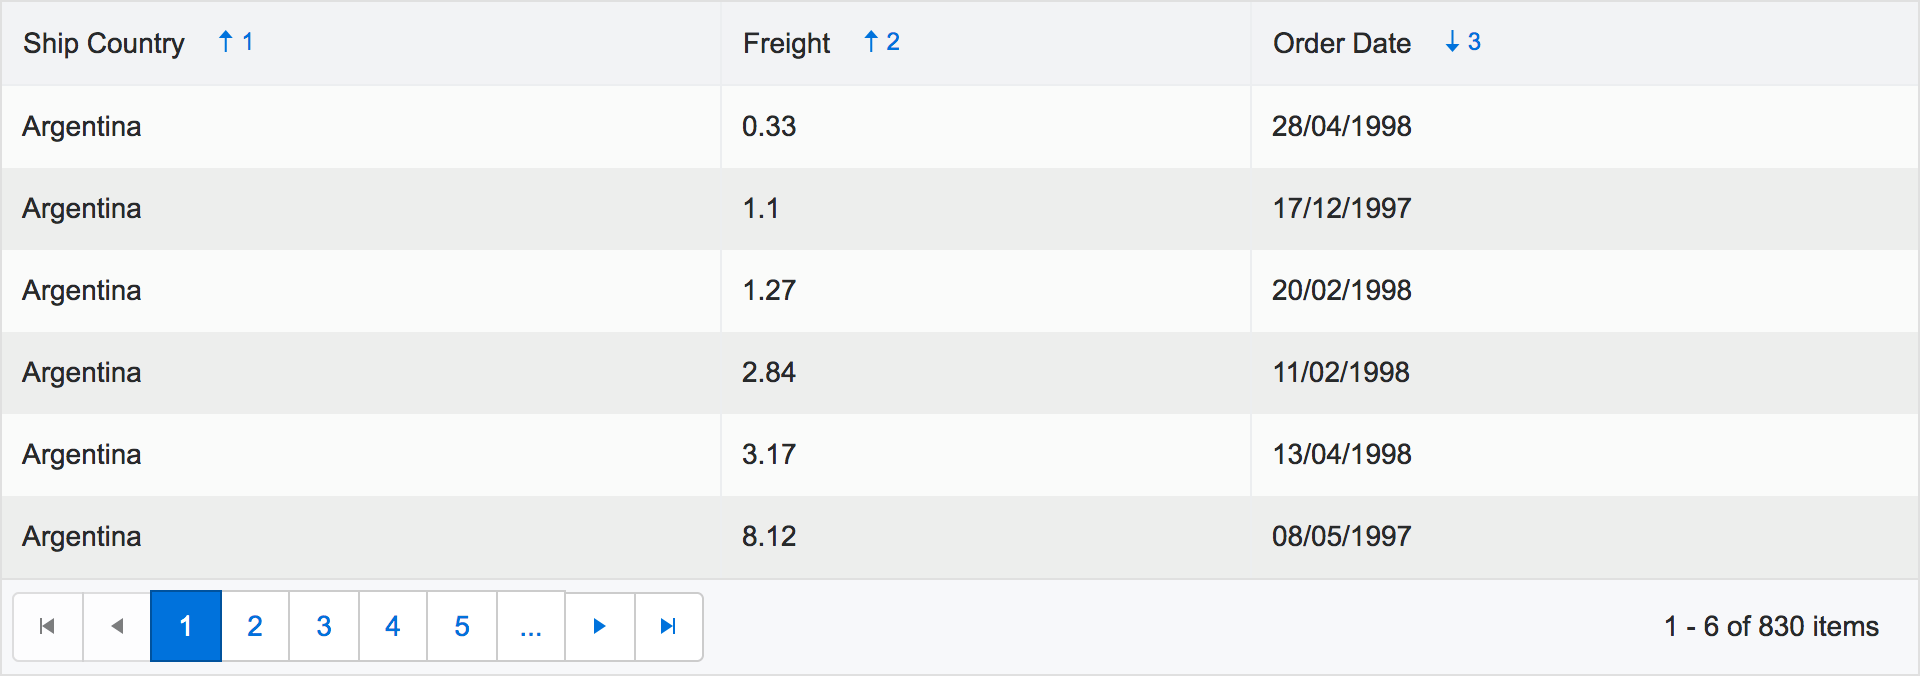
Figure 2: Sorting with multiple sort orders enabled
Tip #5. Leverage Extensible Paging
Paging is another core feature of grids. It enables users to quickly navigate data through pages (or indexes). Most grids provide this capability but few go beyond the fundamentals of paging to include features like extensibility to support custom paging. When selecting a grid, it is important that paging is not only supported, but that it works in conjunction with other features like sorting and filtering. For example, if I sort the contents of a grid then I should be able to navigate the sorted contents through its paging functionality.
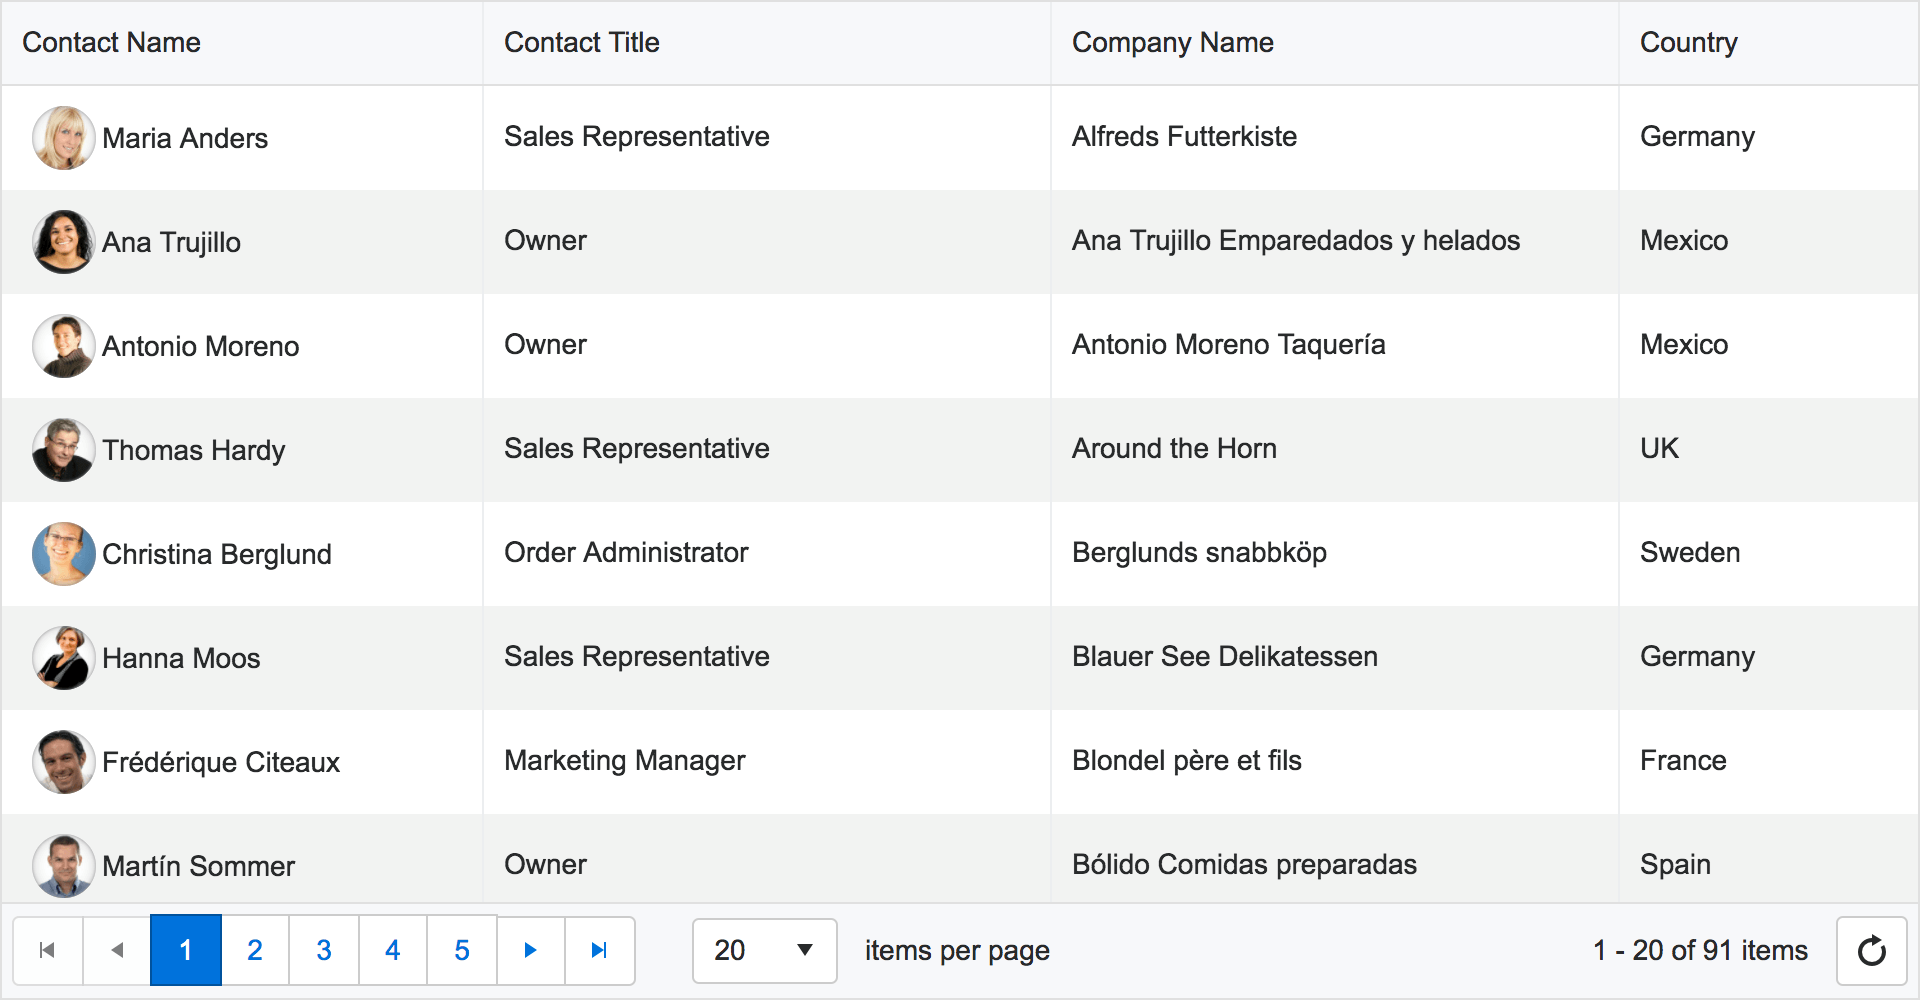
Figure 3: Paging with indexes, an option for items per page, and textual feedback on page location
Tip #6. Utilize Effective Databinding to Remote Data
A grid is meaningless without data. And while binding a grid to data may be a typical exercise, it’s often the task of retrieving the data that poses the greatest challenge. That's why it's important for a grid to support binding to both local and remote data sources. While most grids support binding to local data sources like an in-memory object or collection of objects, few grids support conducting CRUD operations against remote data sources. That’s because they impose challenging requirements such as network latency, data formats, security constraints and messaging protocols. When choosing a grid, it’s important that it provides support for binding to remote endpoints that expose data.
Tip #7. Take Advantage of Push Notifications
Webpages are often viewed as static resources; after a webpage is requested, the data it contains does not change. This is not optimal for situations where updates to the data occur behind the scenes. Ideally, these updates should propagate to the grids that display this data without the need for issuing new requests. Fortunately, protocols such as SignalR and WebSockets facilitate the ability for grids to receive real-time push notifications from endpoints. Supporting protocols such as these in grids provides a vastly improved user experience and should be taken advantage of whenever possible.
Tip #8. Support the Exporting of Data to Multiple Formats
Once a grid is loaded with data, users may wish to export the data to popular file formats like Word or PDF. Many grids don’t provide this functionality out of the box. Instead, it’s a task that’s left to the developer through third-party libraries. A grid should support exporting bound data to these popular file formats as well as simpler representations like JSON or XML.
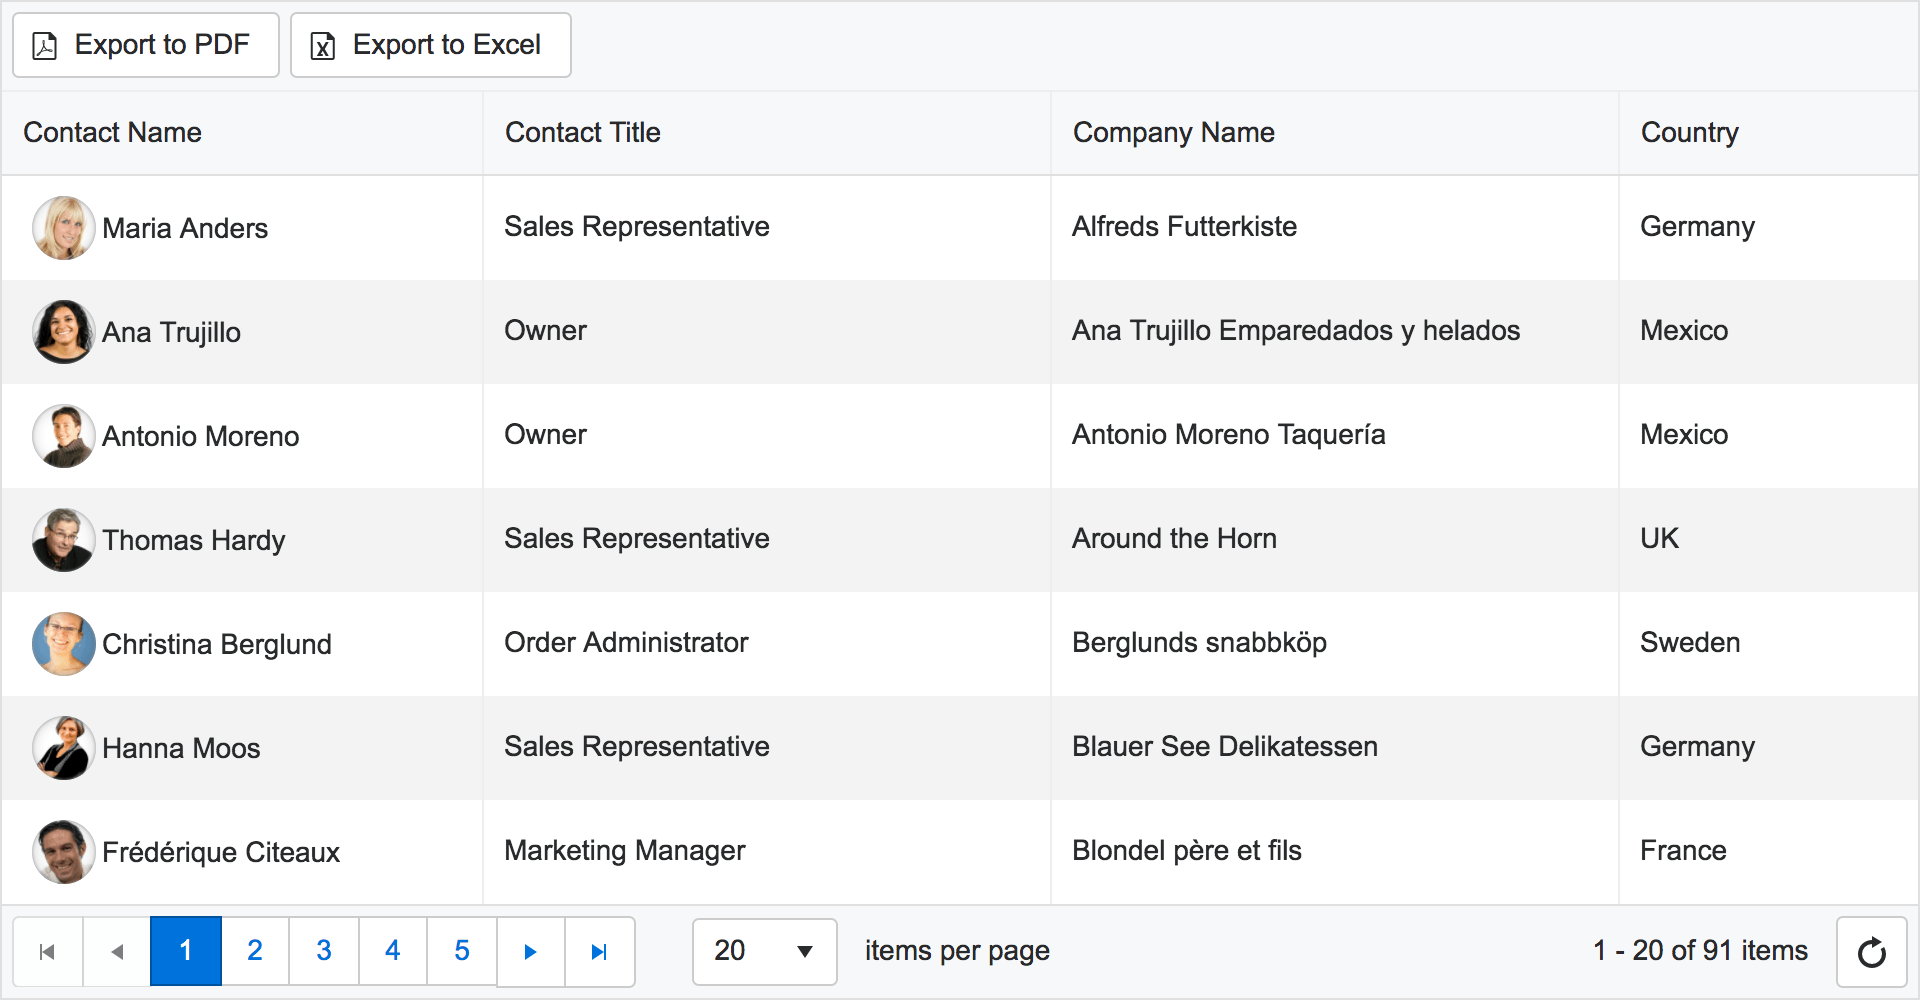
Figure 4: Exporting data in a grid to PDF and Excel
Tip #9. Support Both Batch-Based and Inline Editing of Data
Grids are effective at displaying large amounts of data. However, to be useful, they should allow users to modify the data contained within them. Grids should support the creation of new data, the modifying of existing data and the deletion of entire rows. For a better user experience, grids should support operations either through inline form inputs or external dialogs. Furthermore, the edits made to grids that are bound to remote data sources should support propagating updates either as a batch operation or as single operations performed one at a time on a row-by-row basis.
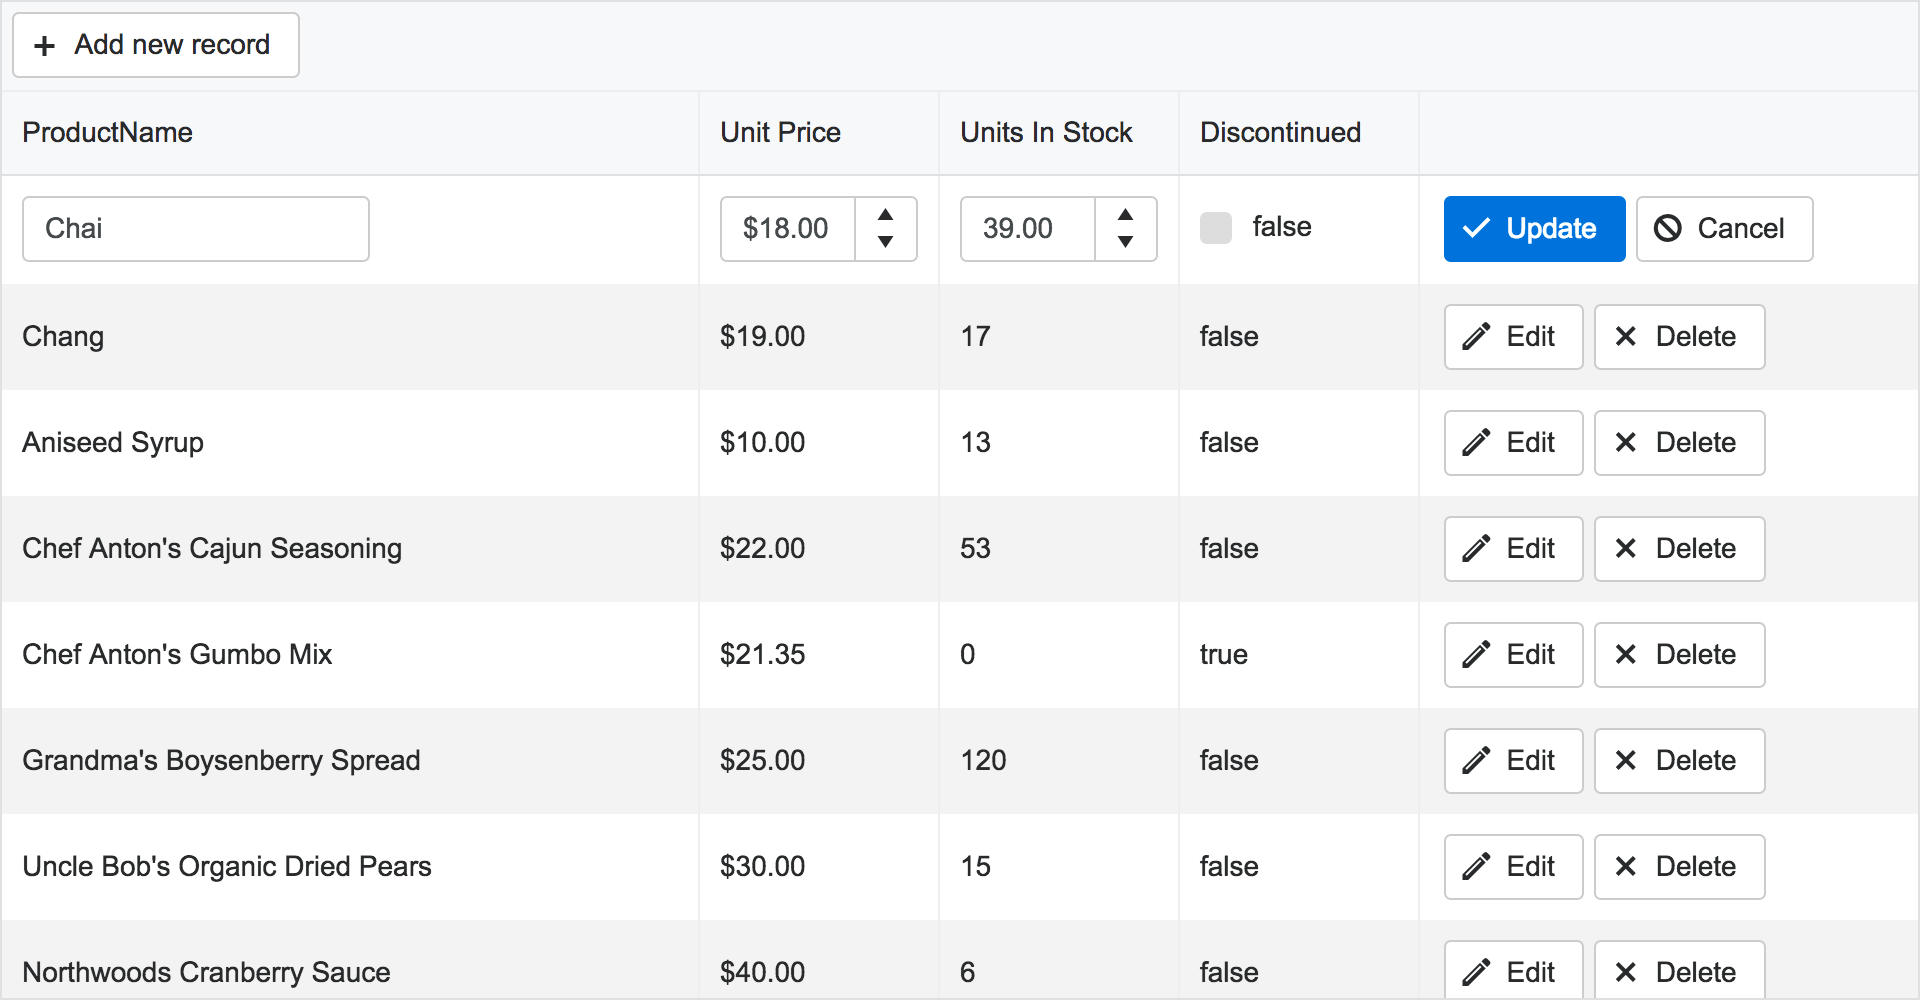
Figure 5: Inline editing of data in a grid
Tip #10. Provide Type-Aware Filtering
A grid can be a highly effective tool for analysing data. However, grids can become overpopulated, making it more difficult for users to gain insights from the data being displayed. That’s why it’s important for grids to apply filters on the data. This capability should be provided for individual columns by type-aware operators like “greater than” or “less than” for numeric values and by Boolean expressions for string-based values. Furthermore, these type-aware filters must work in conjunction with features such as paging and sorting in order to be effective for users.
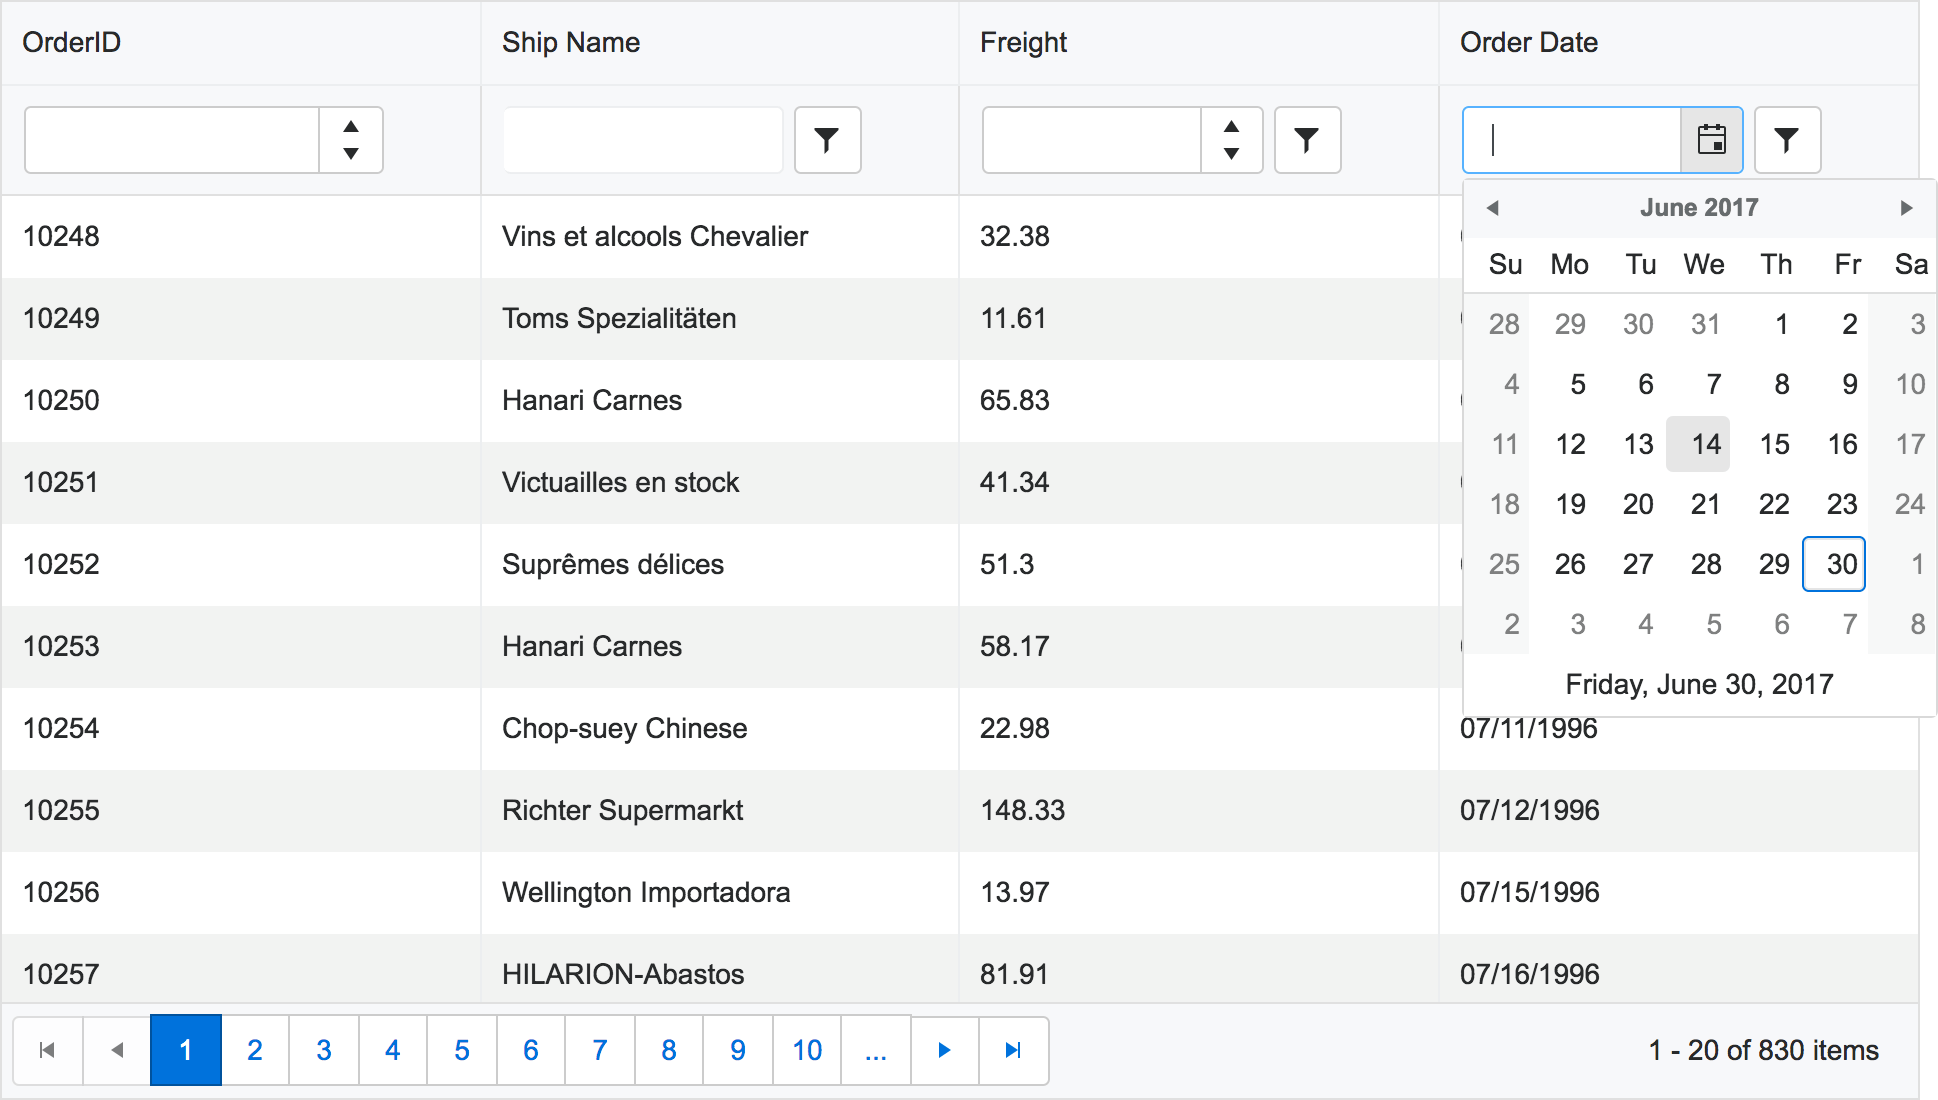
Figure 6: Type-aware filtering on grid columns
Tip #11. Leverage Templates for Data Layout and Appearance
Templates provide the ability to control the layout and appearance of data contained in grids. For example, they can be defined to control the overall output of rows and columns. They can also be defined for peripheral elements like an embedded pager or toolbar. Templates are sometimes overlooked by developers when choosing a grid because they appear simple. However, they are a powerful extensibility mechanism that should be prioritised when evaluating grids.

Figure 7: Custom template used in a grid
Tip #12. Utilize Frozen Columns for Data Navigation
It’s not unusual for the data bound to a grid to exceed the boundaries defined to contain it. This happens frequently with data that has a large number of rows. In the case where the data has a large number of columns, it’s useful for grids to support frozen columns. These are columns that remain displayed in the grid when the user moves from side-to-side when navigating the data horizontally. It’s a feature that’s useful when correlating values against the data that’s found in these frozen columns.
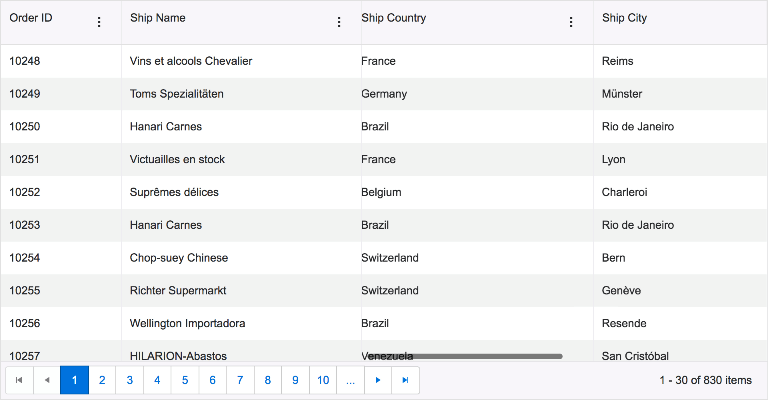
Figure 8: Frozen columns displayed in grid (note the scrollbar at the bottom)
Tip #13. Utilize Themes
Themes are important because they provide a consistent experience for the user. It is important that grids provide the ability to customize their appearance and behavior. Grids should provide a set of themes that match popular user experiences like Google’s Material Design. Furthermore, these themes should be documented and easily modified to suit a range of requirements. When targeting grids, it is important that you utilize the themes provided. They also provide the added advantage of being able to swap them out for alternatives should the need arise.
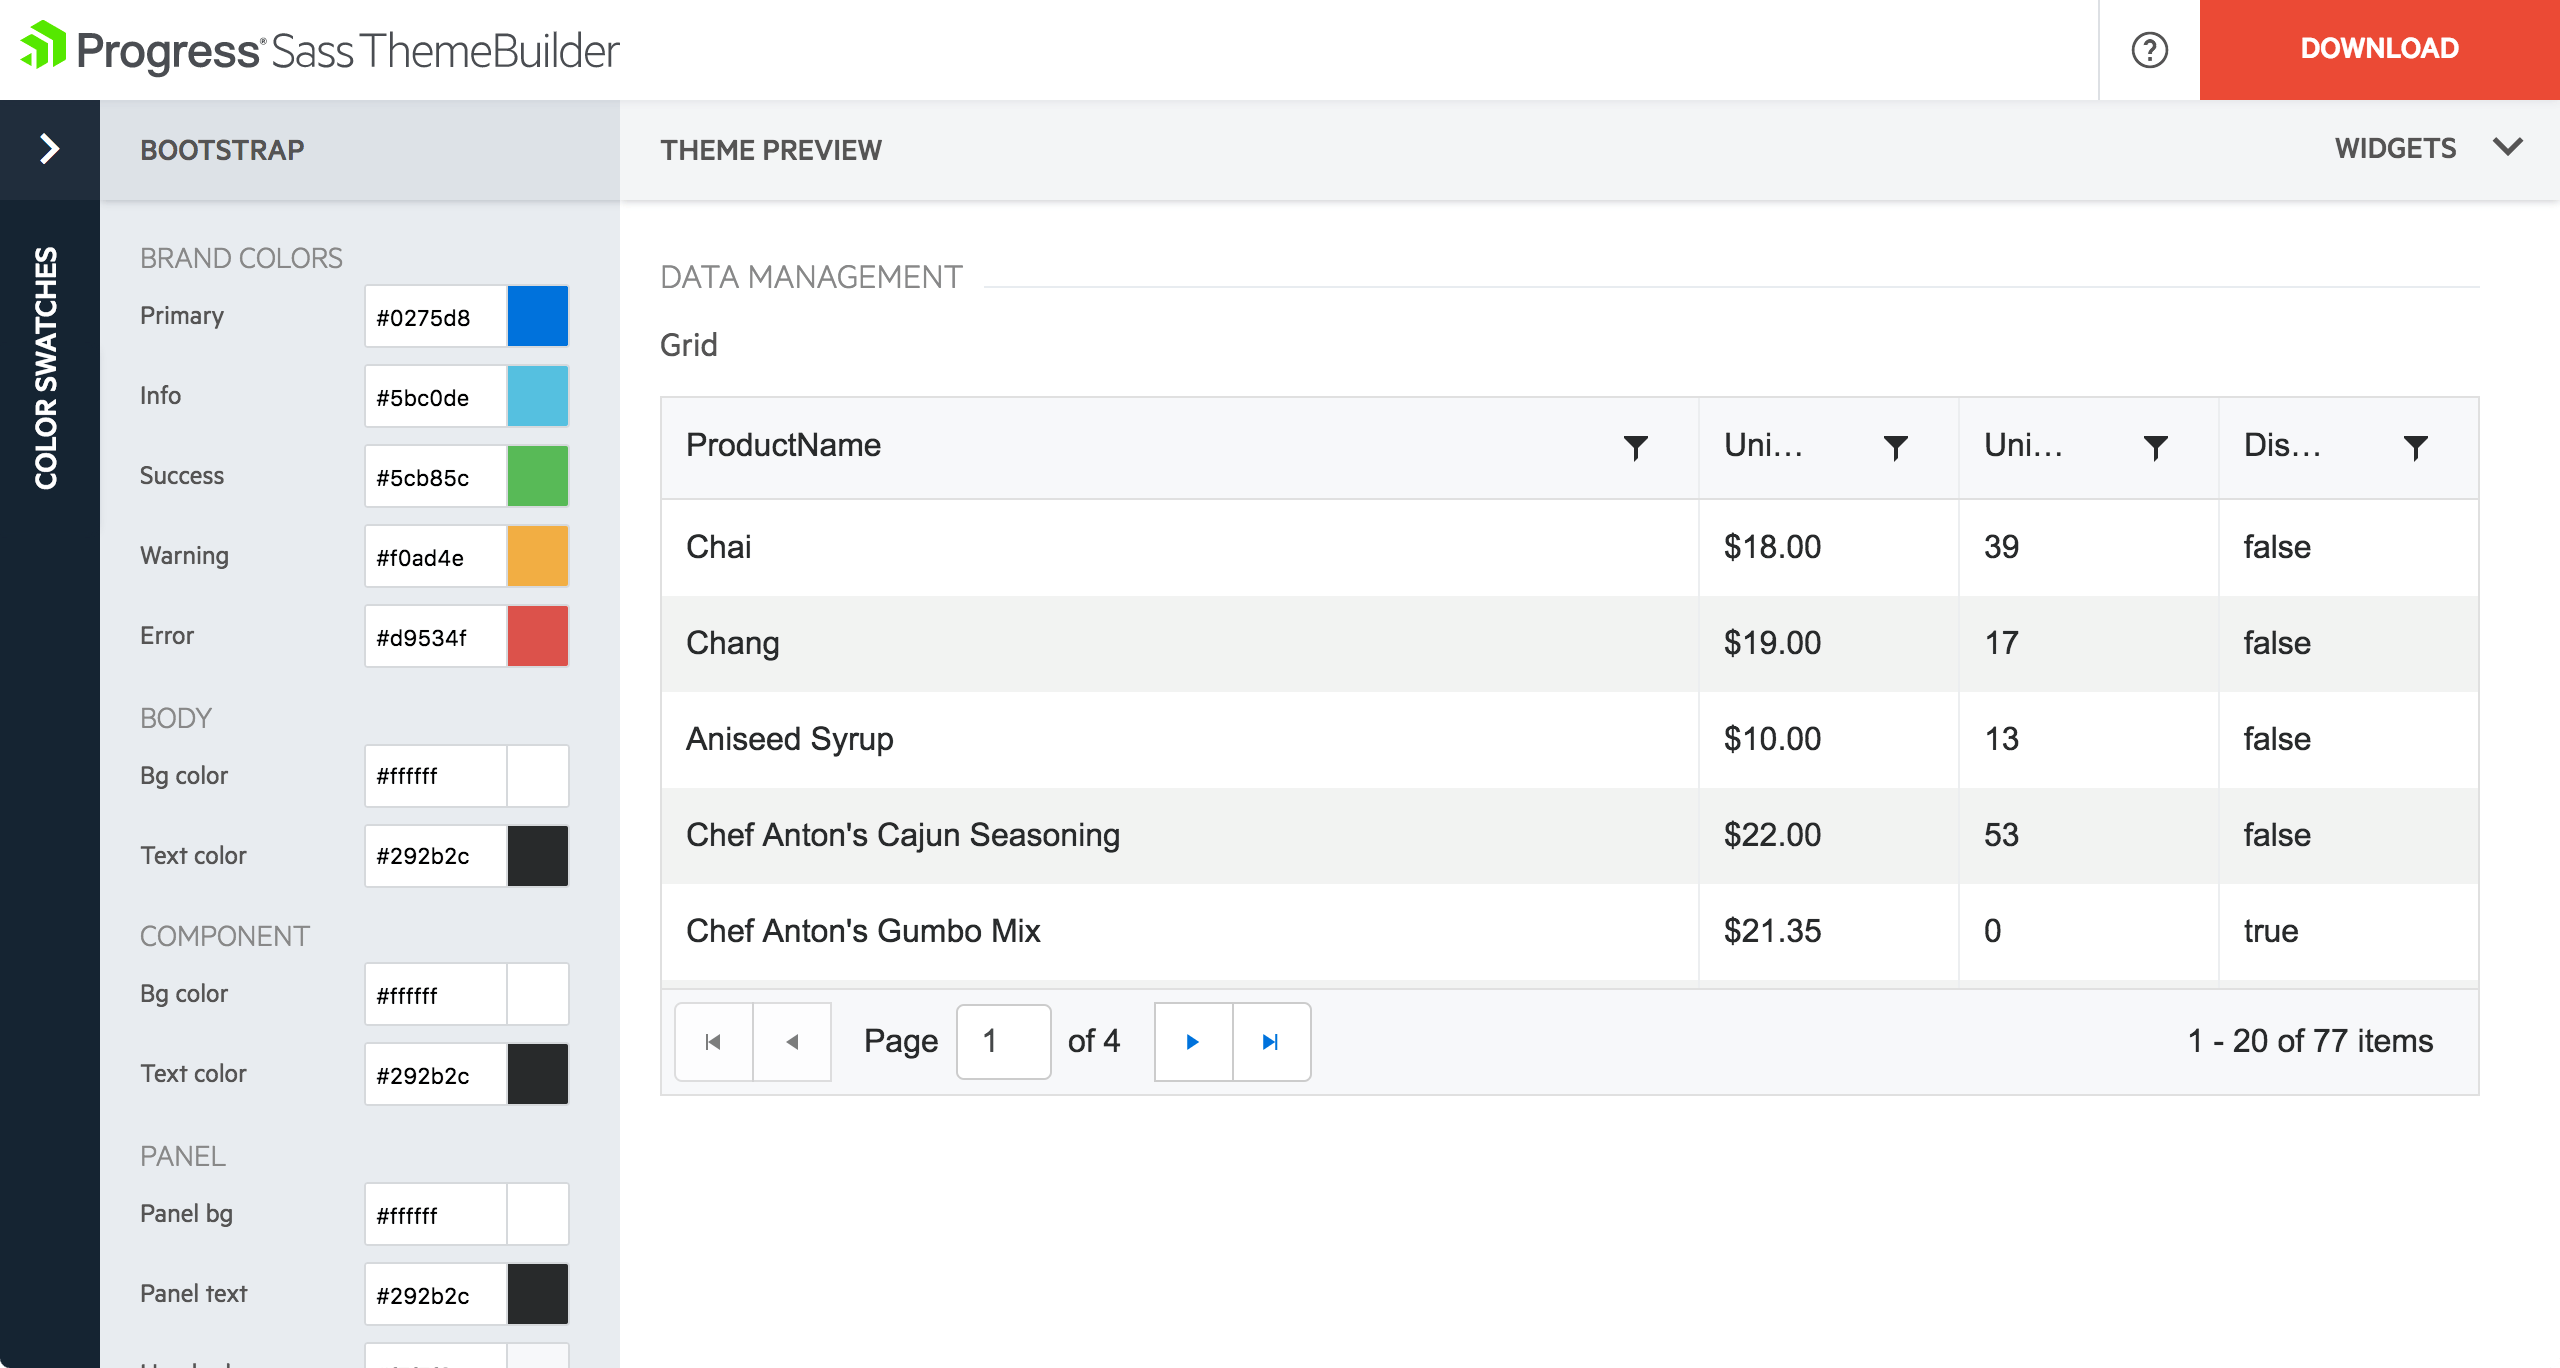
Figure 9: Grid theme support (example: Progress Sass ThemeBuilder)
Tip #14. Support for Responsive Design
Responsive design is facilitated through media queries and layout grids via CSS. However, in the case of grids that are used to display data, more work is needed in order to support a design that’s responsive. The web isn’t just isolated to the desktop browser anymore, it’s available on a wide range of devices with different resolutions. A grid must be able to support a responsive design out of the box in order to provide a good user experience. It is important to think about the common scenarios for grids used to display data. Most grids support responsive design by hiding the right-most column for each display breakpoint that’s encountered for the variety of screen resolutions that exist. This is a good solution for most general cases. However, it may be worth preserving the visibility of these columns, especially if they contain important values such as a total sum. These scenarios must be considered carefully.

Figure 10 Left: Grid with 1280 pixel width, Right: Grid with 566 pixel width
Tip #15. Use Embedded Data Visualizations
Data can be hard to understand—that’s why we use charts and graphs to visualize it. This helps spot trends and gain insights. In many circumstances, it’s useful to have a visualization in close proximity to the data in a grid. A grid should support this capability through sparklines and/or embedded charts.
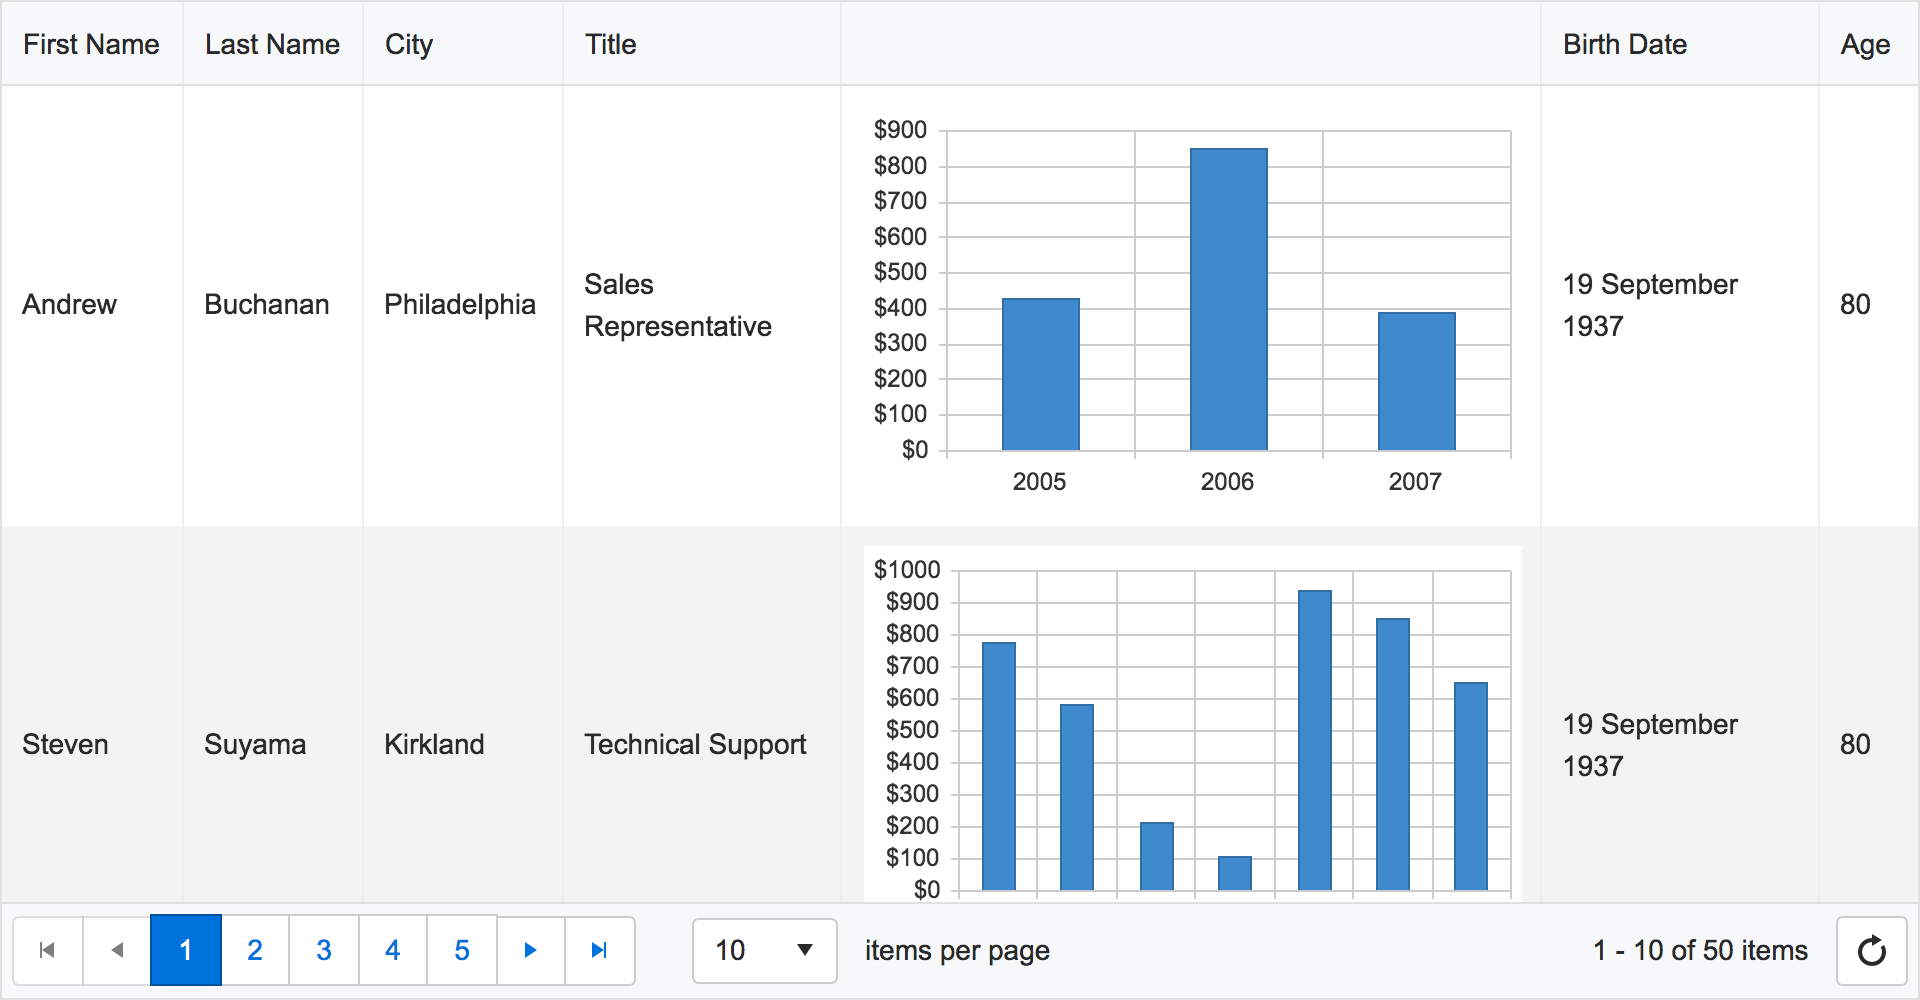
Figure 11: Grid with embedded charts
Tip #16. Support Detail Templates
The structure of data is often hierarchical. Therefore, it should be represented as such in grids. Providing a detail template for data helps users to gain more insight by allowing them to drill into related rows. Grids should provide the ability to support hierarchical data and enable users to see the related items when expanded inside the display itself.
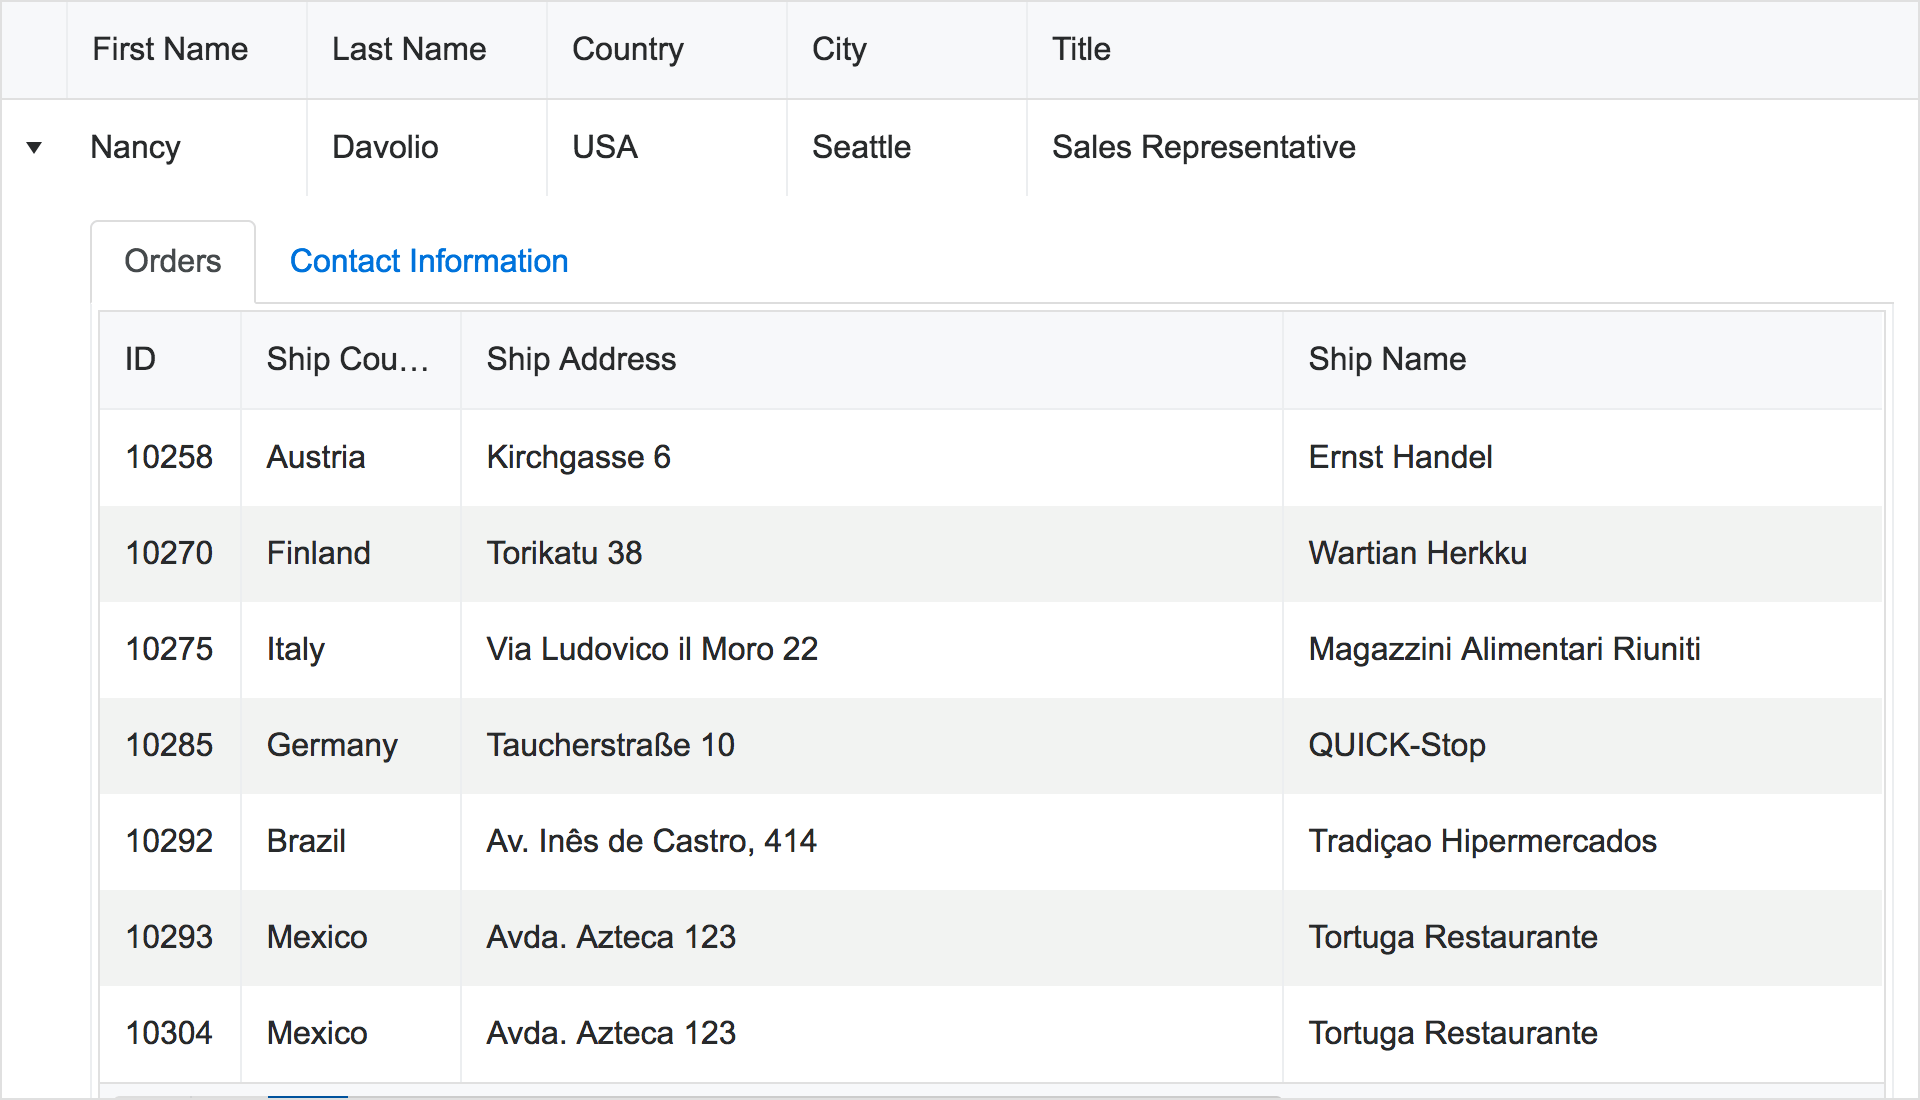
Figure 12: Grid with details provided through a tab strip
Tip #17. Use Aggregates to Provide Insights into Data
Aggregates are calculations based on the grouped data that they contain. They are often found at the bottom of grid groups or columns. They are useful because they provide insights into grouped data without the need for additional columns. An effective use of aggregates in grids provides these summaries whenever they are available to be displayed.
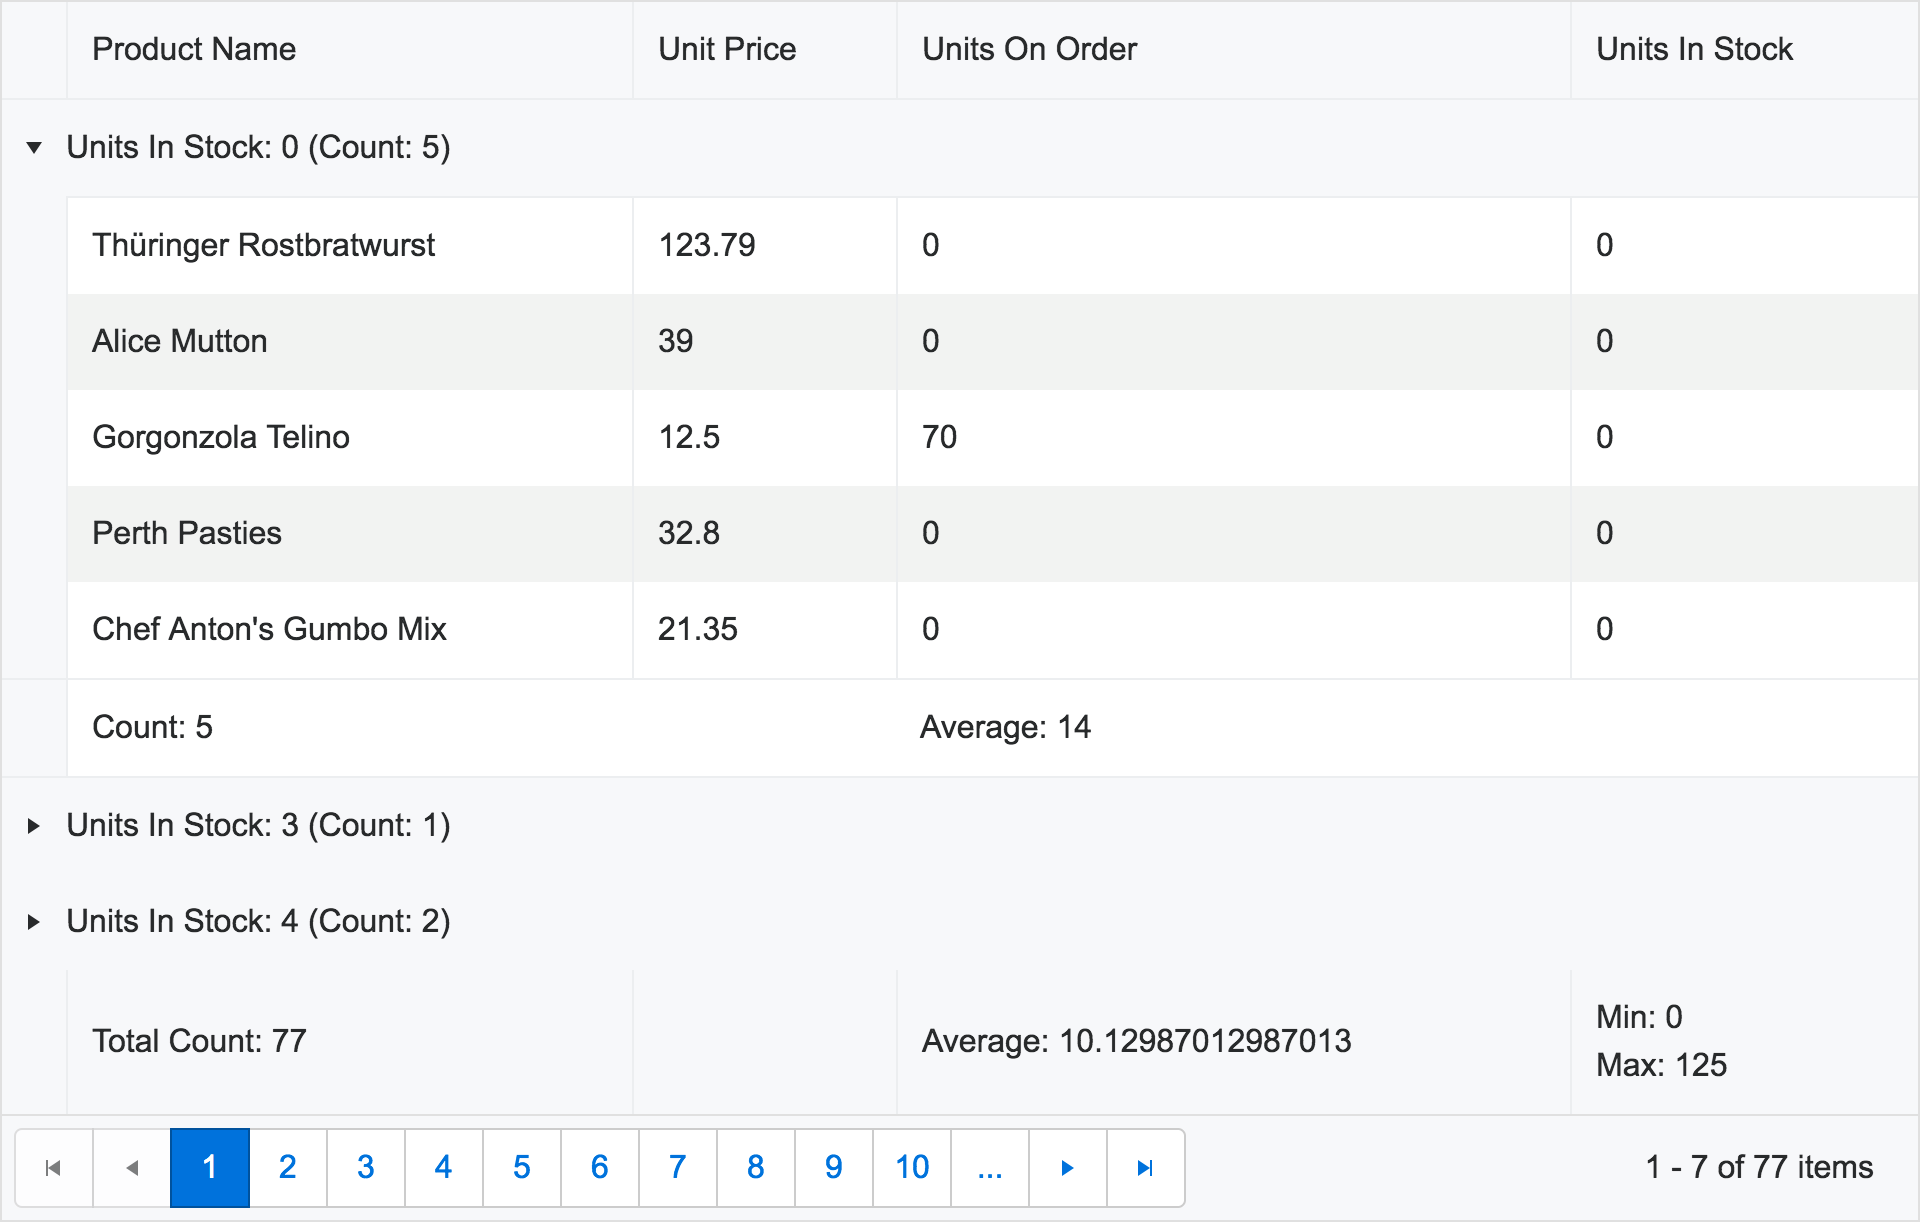
Figure 13: Grid with aggregates provided for grouped data
Wrapping Up
As you can see, grids provide a powerful control for encapsulating data. Use them effectively and you can provide users with lots of insights into data. We hope these tips help ensure that you get the most out of the grids you use in your web applications.
Learn More: Kendo UI and the Kendo UI Grid
We've used our own Kendo UI Grid in the examples shown above. If you're not familiar with it, this grid, like the other components in the Kendo UI library, provide users with a rich set of features and easy integration with any environment. Now that you’ve seen some of the features you should be looking for in a grid component, feel free to take a look at how that works with a real life example. Kendo UI is available for a free trial and comes with examples and extensive documentation. Head to the Kendo UI website to find out more.

John Bristowe
John Bristowe is a member of the Developer Relations team at Progress. He specialises in web and mobile app development.
