New Features and Improvements in Telerik Reporting R3 2018

Summarize with AI:
We are excited to announce some great new features in the latest release of Telerik Reporting, with improved visualizations, PDF/A exporting and more. Read on to see everything that's new in R3 2018.
It's time to share all the latest improvements in Progress Telerik Reporting, including data consolidation within Pie Charts, PDF/A exporting, the ability to email reports from the report viewers, a better display of missing values in the Line and Area Series of the Graph, and finally many bug fixes.
In this blog post I will elaborate on the important improvements and bug fixes we have introduced in the 2018 R3 release.
Pie Charts Data Consolidation
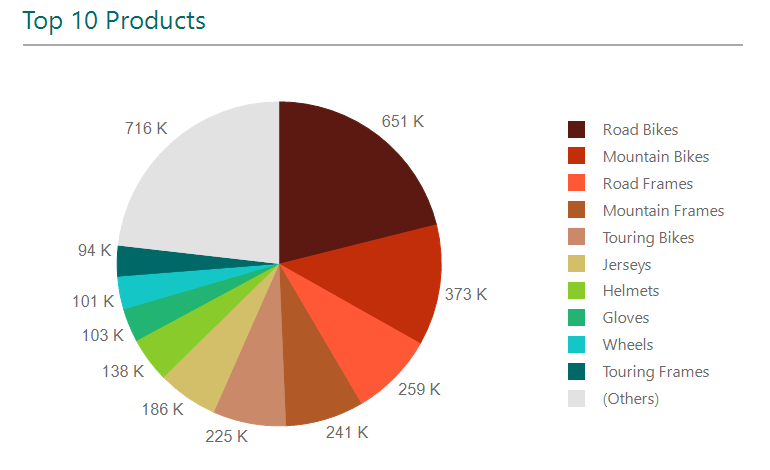
We've increased the data representation of pie charts by consolidating insignificant data into a single slice.
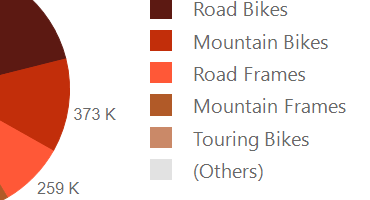
With the R3 2018 release, we've made it easier to represent pie chart data in an easily consumable form. Report authors can now consolidate small slices in pie or bar charts wherever applicable, so that chart visualizations don’t get cluttered.
PDF/A Export
You can now utilize this highly-compatible version of the PDF format to match end-users' requirements.
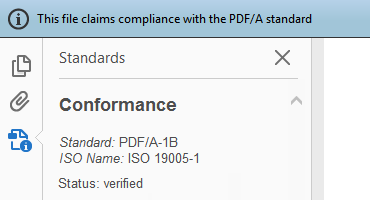
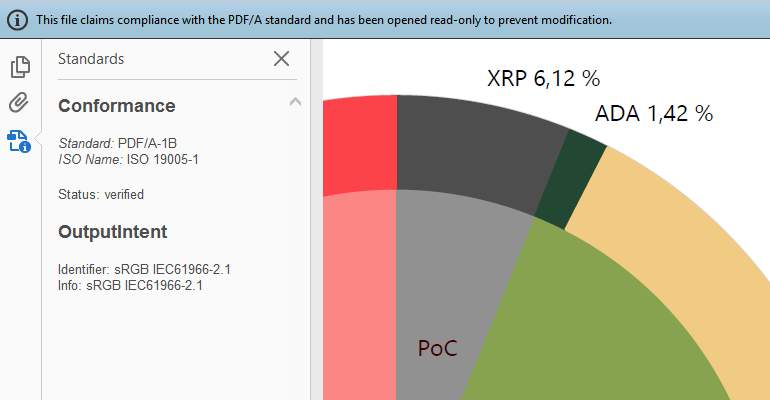
PDF is the most used export format in Telerik Reporting. In our third release of 2018, we’ve added support for the PDF/A ISO-standardized version of this format, specialized for use in archiving and long-term preservation of electronic documents. It is self-contained in terms of needed assets (e.g. fonts, encryptions, annotations), ensuring that the document will look exactly as-is on any machine.
Email Report from The Report Viewers
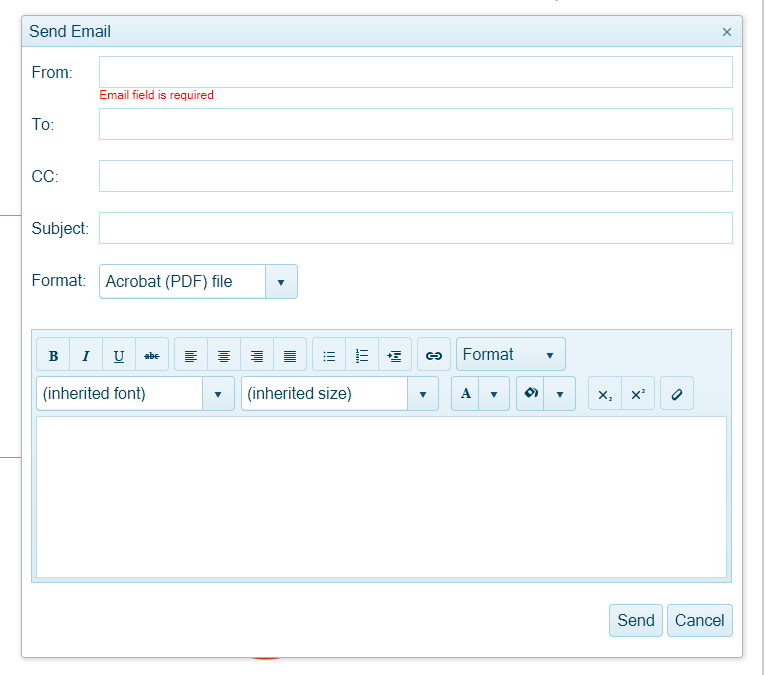
End-users are now empowered to directly initiate an e-mail that includes the viewed report as an attachment.
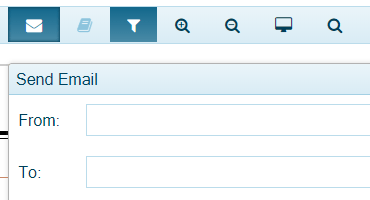
With R3 2018, we’ve enhanced the end-user experience by allowing users to easily compose a new email message containing the generated report as an attachment. That eliminates the need to export and save the file on the system prior to sharing via e-mail.
Correctly Display Missing Values in Graph’s Line and Area Series
The Graph item now correctly represents the data points with missing values in line and area series in a Cartesian coordinate system. This allows you to configure the appearance and styling of the segments as needed.

Eliminated Bugs
As always, we've worked hard to eliminate bugs and make Telerik Reporting as smooth and stable as we can. For the full list of all the bug fixes, check the release notes for Telerik Reporting and Telerik Report Server.
Try it Out and Share Feedback
We want to know what you think—you can download a free trial of Telerik Reporting or Telerik Report Server today and share your thoughts in our Feedback Portal, or right in the comments below.
Start your trial today: Reporting Trial Report Server Trial
Tried DevCraft?
You can get Reporting and Report Server with Telerik DevCraft. Make sure to downloaded a trial and check it out, or learn more about all our DevCraft bundles. DevCraft gives you access to all our toolsets, allowing you to say “no” to ugly apps for the desktop, web or mobile.
Watch the R3 Release Webinars
To see all the latest changes and updates across our new release in action, please join us on the Telerik UI R3 2018 webinar, on October 2, 2018 at 11 a.m.

Silviya Boteva
Silviya Boteva is a Frontend Developer at Progress. Her passion is creating a pixel-perfect UI and breathing life into the UI components with React. In her heart, she is a traveler, a Bulgarian folklore dancer, bookaholic and coffee addict. Her most loved ones (except her family members) are her two sweet cats.
