Elevating UX in Reports: Explore the Enhancements in the Web Report Designer

Summarize with AI:
What does Telerik Embedded Web Report Designer do? Everything you need to build the right reports for your applications. Now with even more UI/UX opportunities.
Progress Telerik Reporting Web Designer is a versatile and user-friendly web-based tool that empowers business users to easily create fully functional embedded reports. It’s designed to help businesses streamline their reporting process by providing an intuitive interface, powerful data binding capabilities, advanced report layout, interactive features and support for shared data sources.
With the latest release, we made a lot of meaningful UX improvements to the Web Report Designer that will enhance the user experience. Let’s take a look.
Better Visual Separation of the Properties Area
The Properties area is an integral part of the Web Report Designer. It enables the report author to apply changes to each of the countless settings of the currently selected entity (like a report item, data source or report parameter, to name a few). Each property has an editor that goes with it. Much has been done to make the area easy to use. For example, the global search, which can be found at the top of the page, allows you to quickly find the editor you need.
However, we feel that the layout of the area is also important, and this release we tweaked it by adding indent line guides so that the properties area is even more convenient and clear.
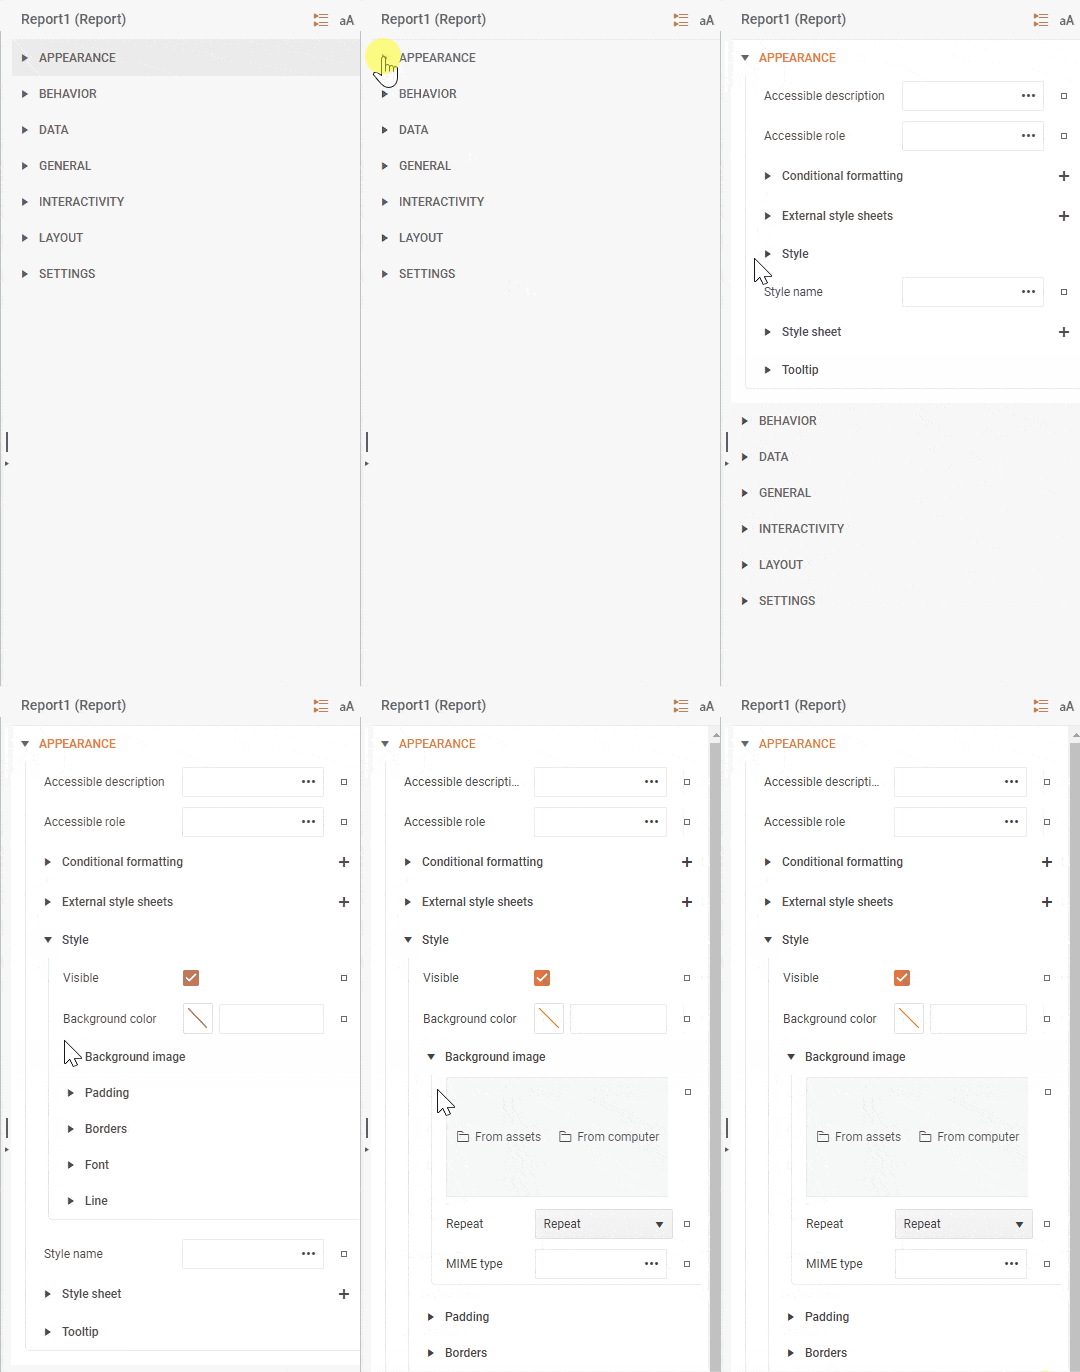
Now you know exactly where you are in the editor hierarchy.
Introducing the Improved HtmlTextBox
KendoUI HtmlTextBox Value Editor
This release sees a vast improvement in the way we work with HTML in Web Report Designer. With the help of the Kendo UI Editor, the widget now has its own HtmlTextBox value editor that provides immediate visual feedback when creating and editing HTML. Of course, the old text editor for raw HTML is preserved as well and is one button click away.
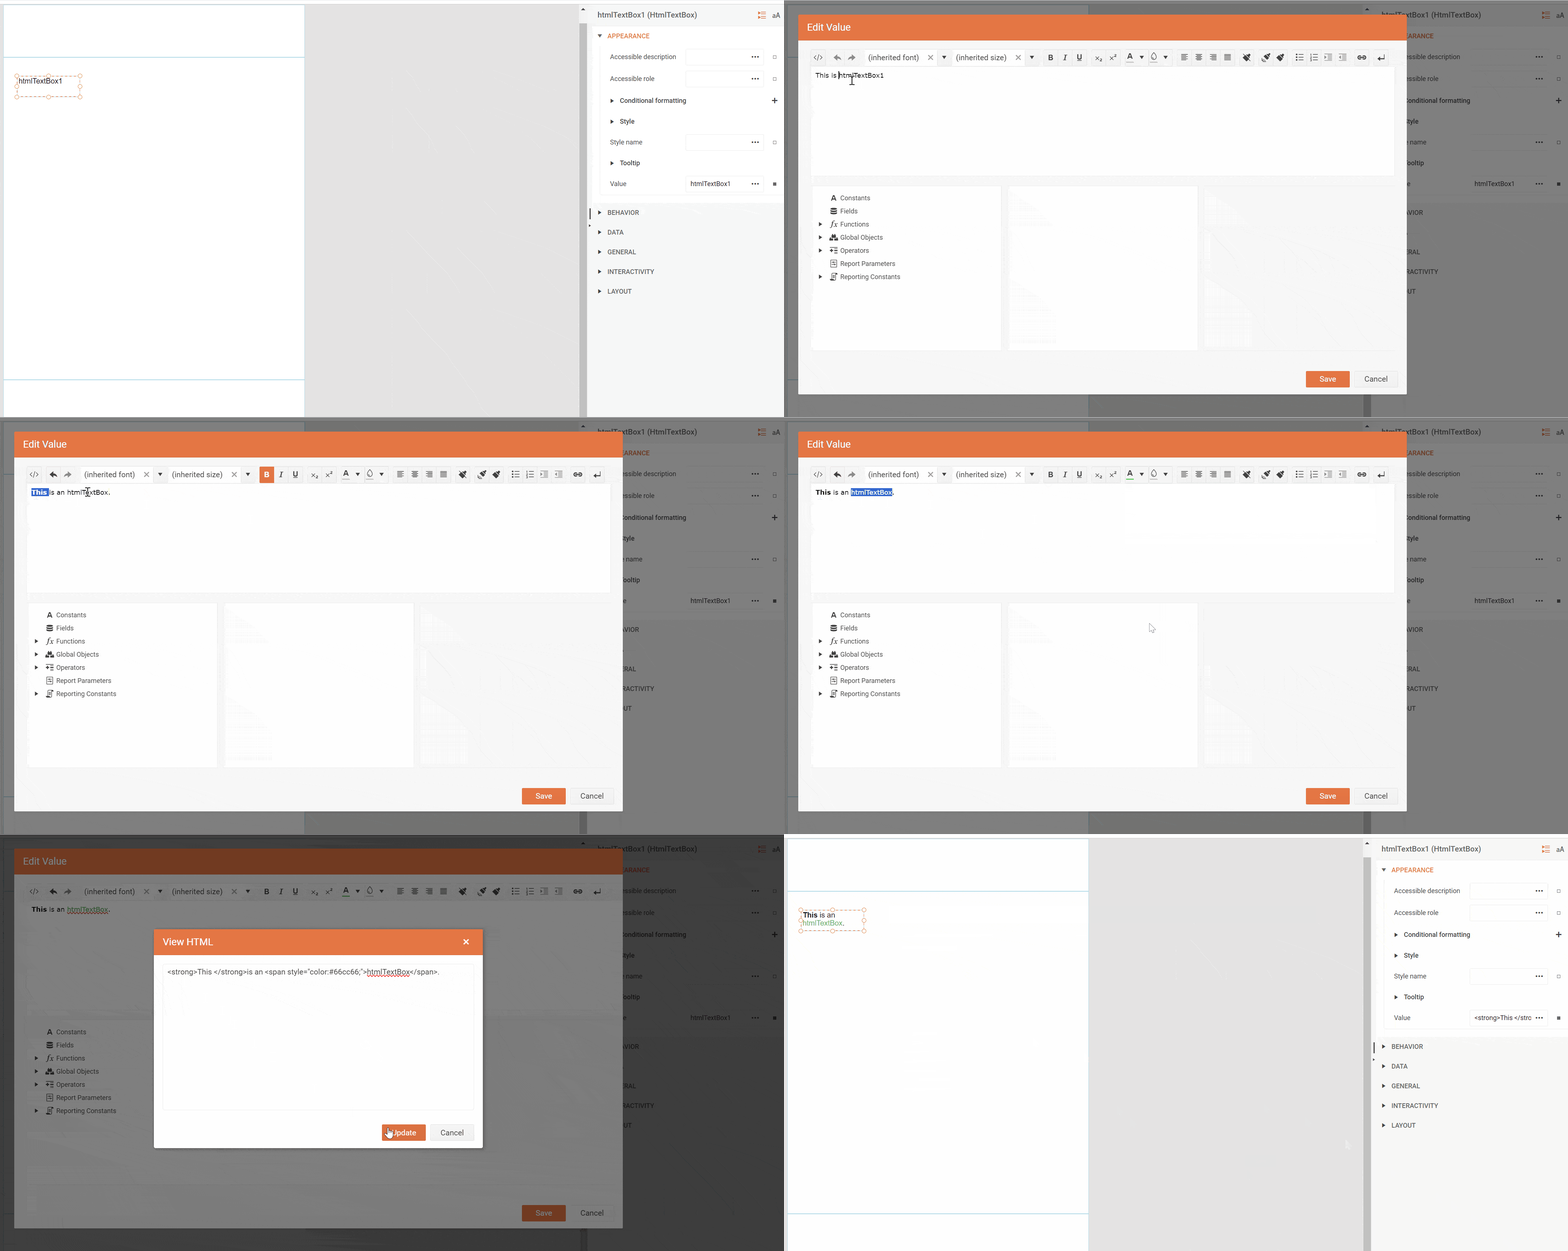
Improved Expression Insertion
We took the opportunity to iron out an issue with the insertion of expressions in the HtmlTextBox. As things were, when an expression is inserted in an empty editor, it appeared in the format =SomeFunction(). This behavior created some frustration as, if more content was added to the box, the expression would have to be swapped with an embedded one. With the recent release, all expressions will come as embedded by default.
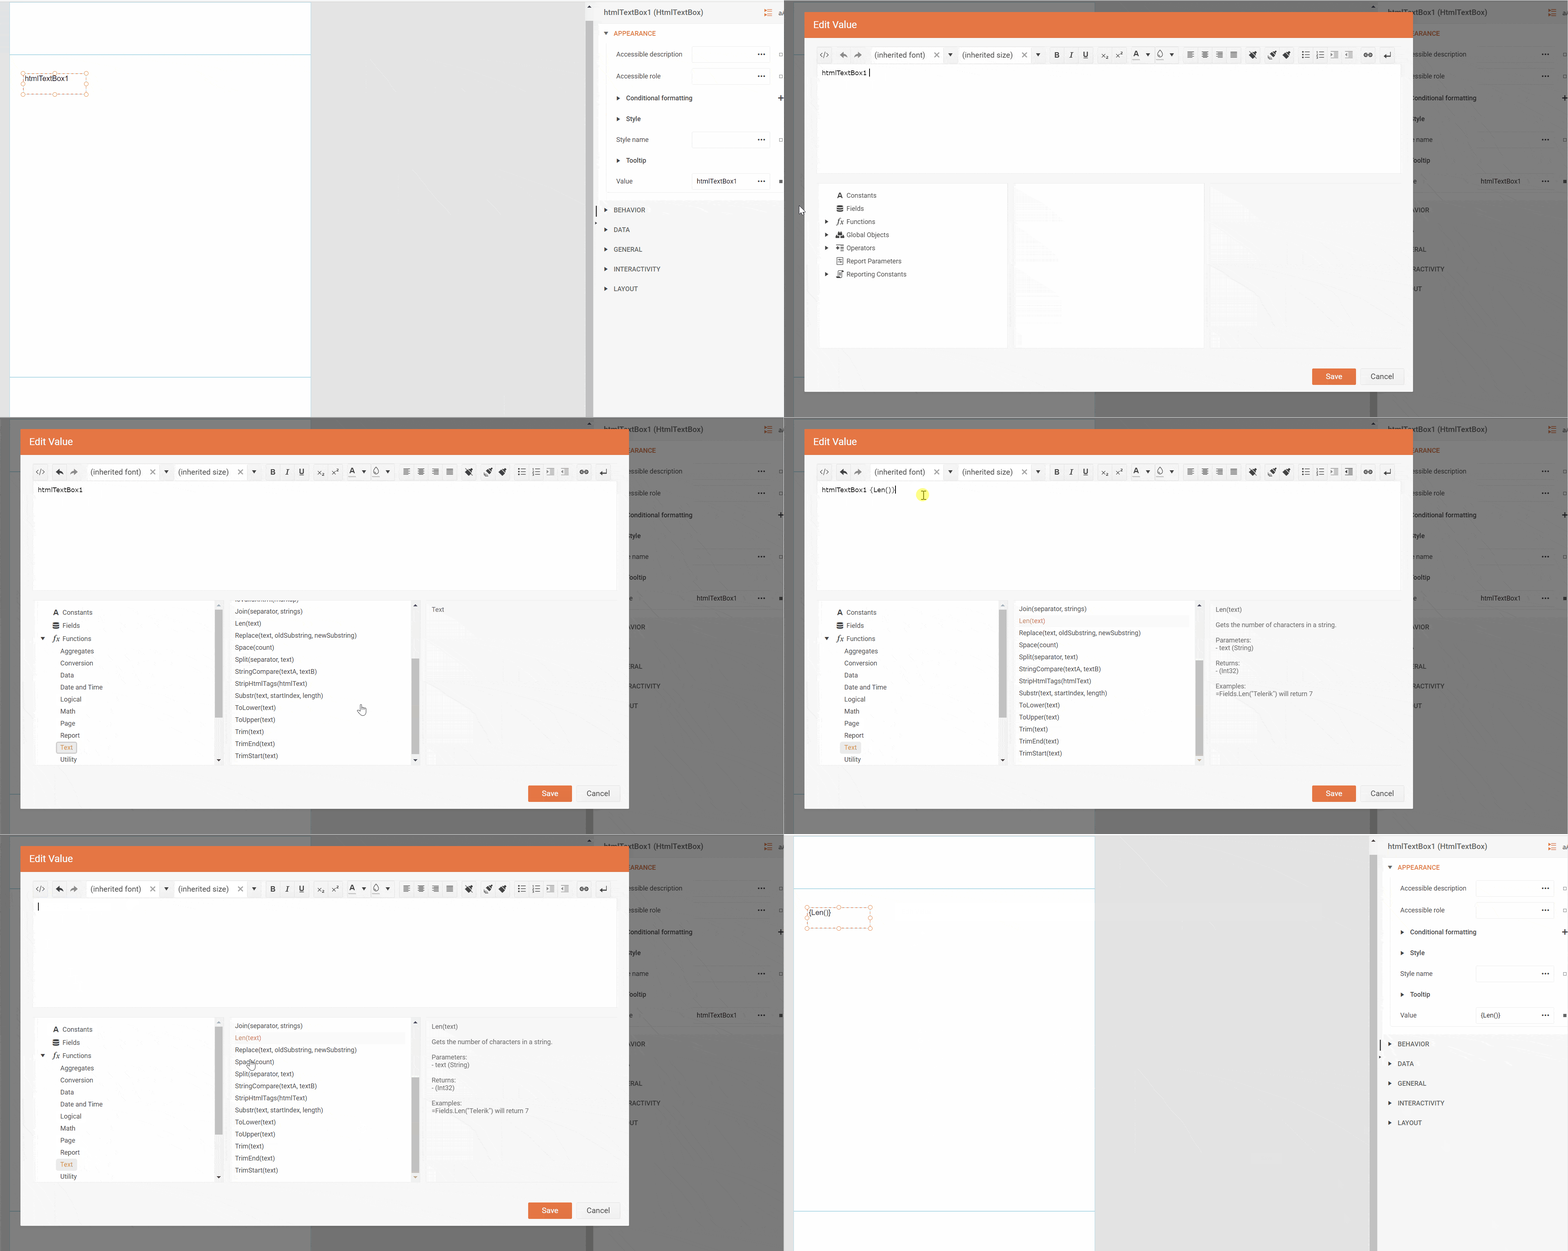
We believe that, with these changes we have made to the HtmlTextBox, working with HTML will be a breeze. We hope both developers and users will love them as much as we do.
Flexible Table Columns
2024 Q1 also brought a highly requested step forward in the way we work with table columns. Previously, once a column was created, its position was set in stone and, to move it, you would have to delete and recreate it. This is no longer the case and now columns can be moved and swapped using a context menu option.
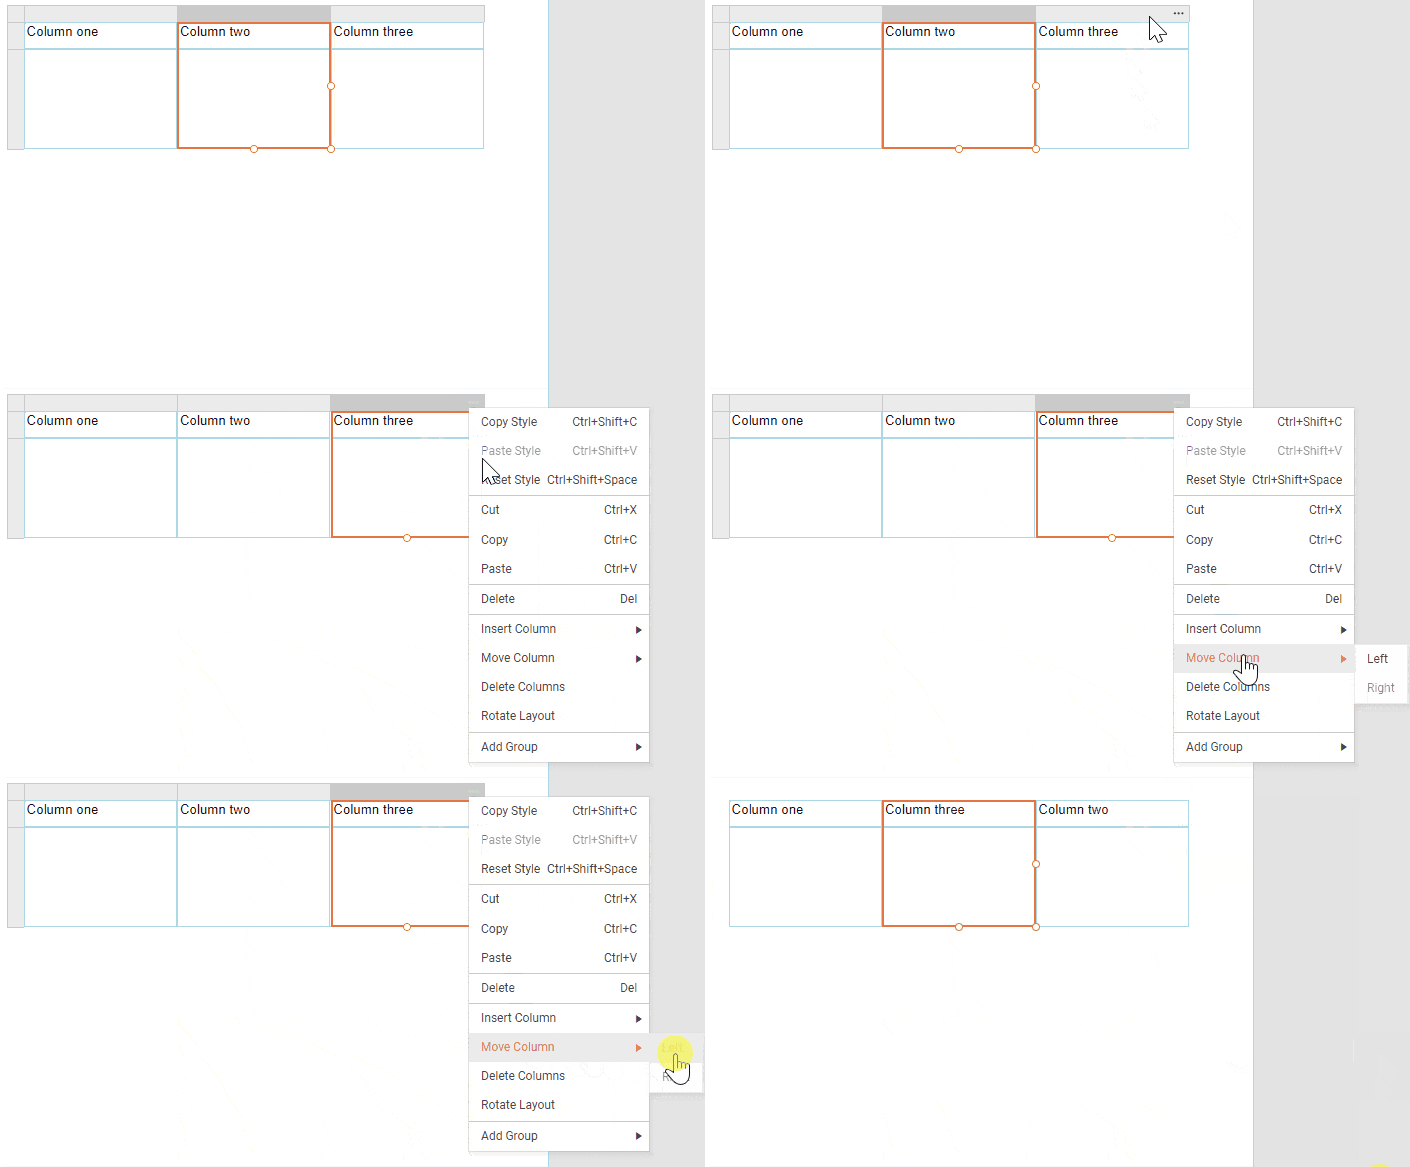
Merged cells are also not an obstacle:
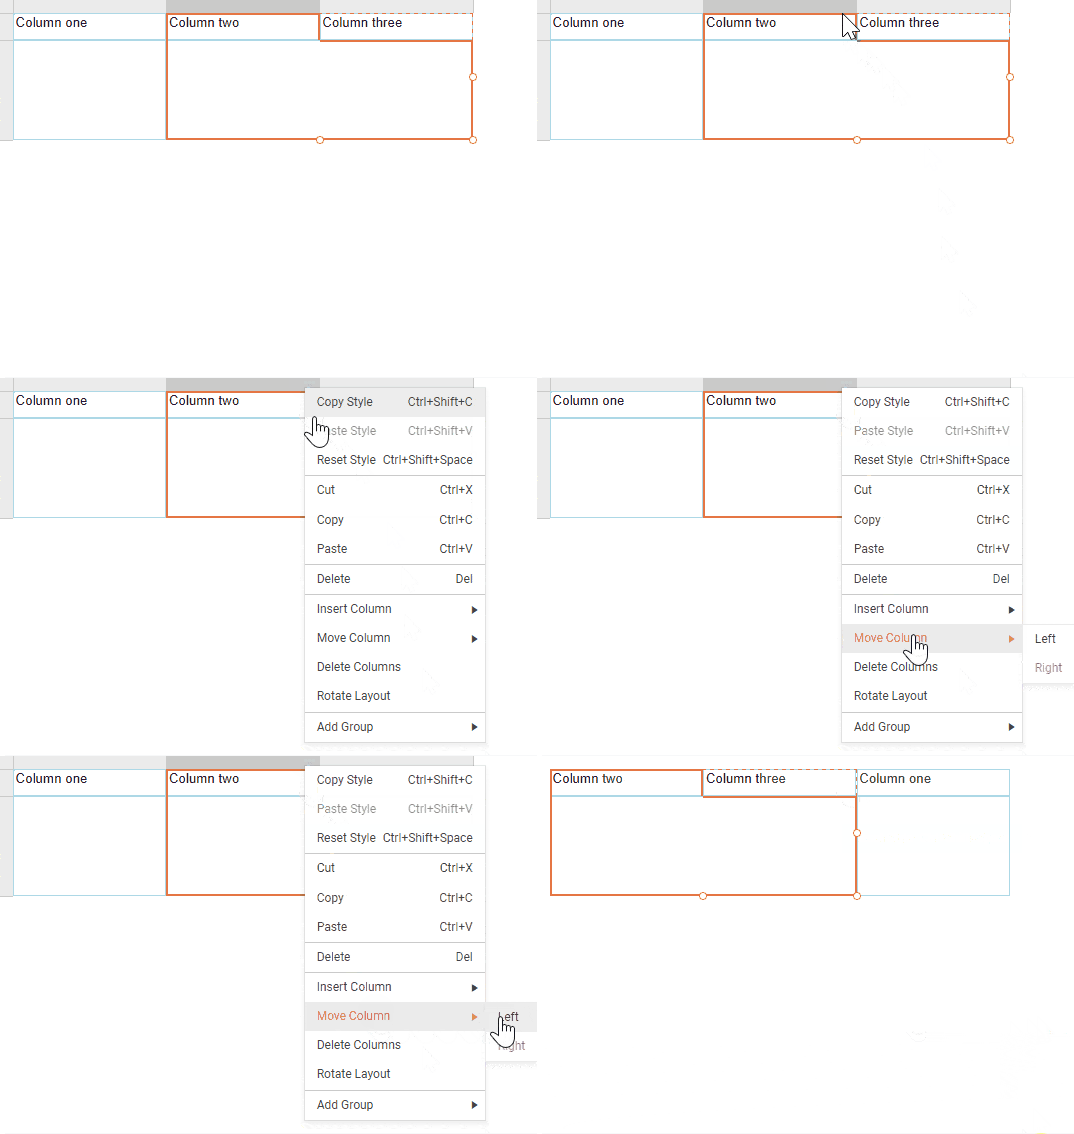
This feature is a game-changer for the user who works with tables often and it is a big leap forward in their usability.
Adding New Bindings Made Easier
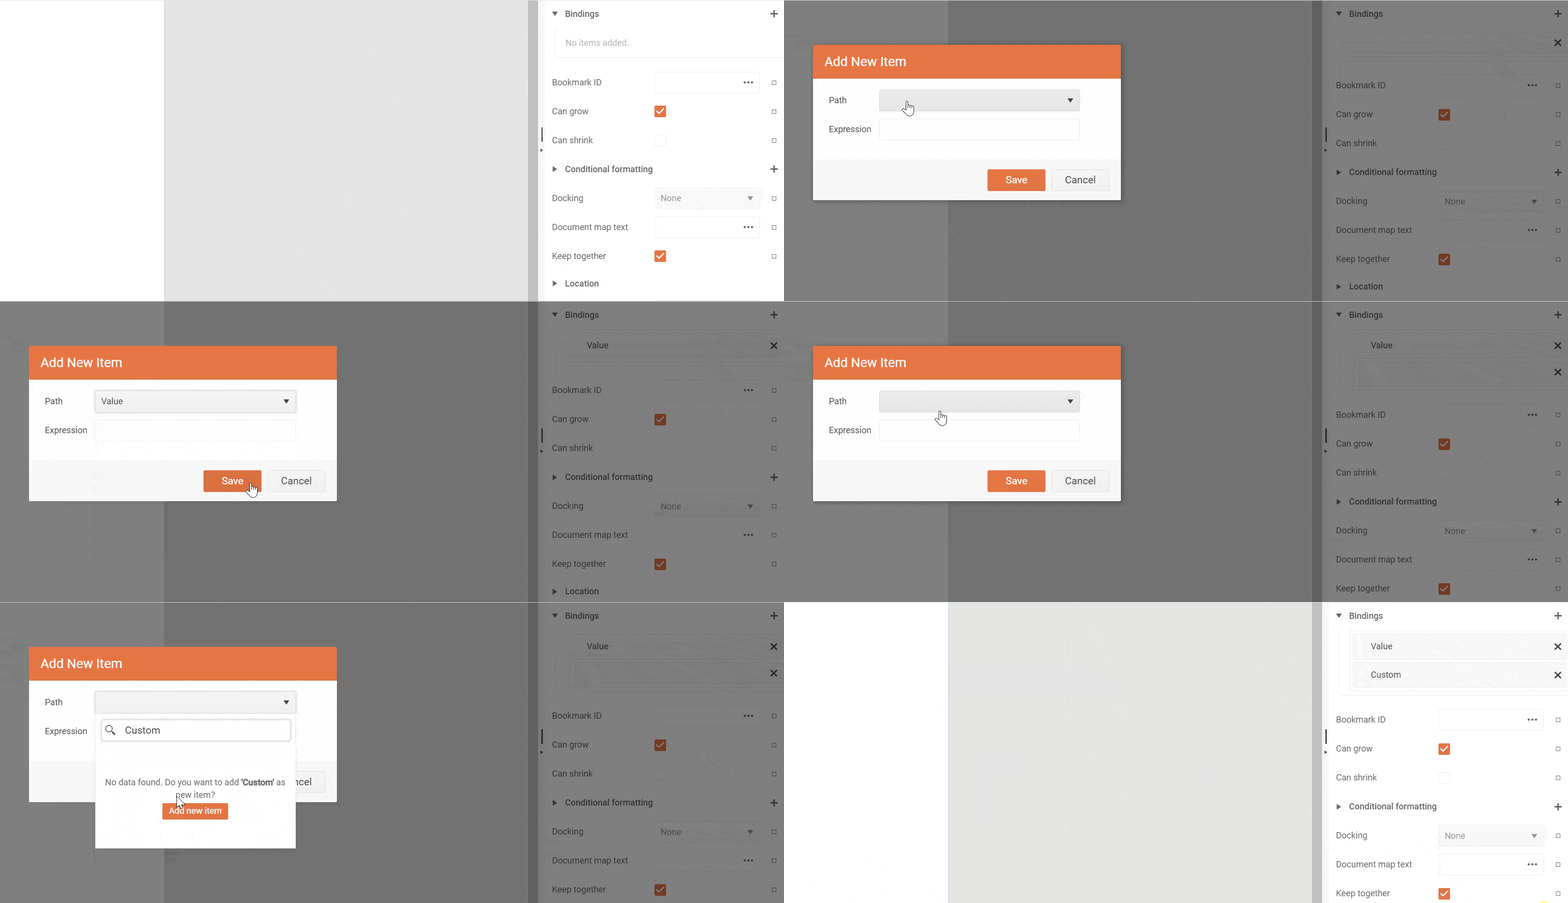
Starting with 2024 Q1 PI1 the Bindings’ Add New Item dialog now has the available binding paths populated in advance. Another convenient feature that the Standalone designer has, and another inconsistency erased between the designers.
Of course, the feature comes with search and an option to add a path that was not found in the list. Creating bindings can be cumbersome and even a little daunting for some users and we believe that this feature will make it less so.
Tooltips for Labels and Values in the Properties Area
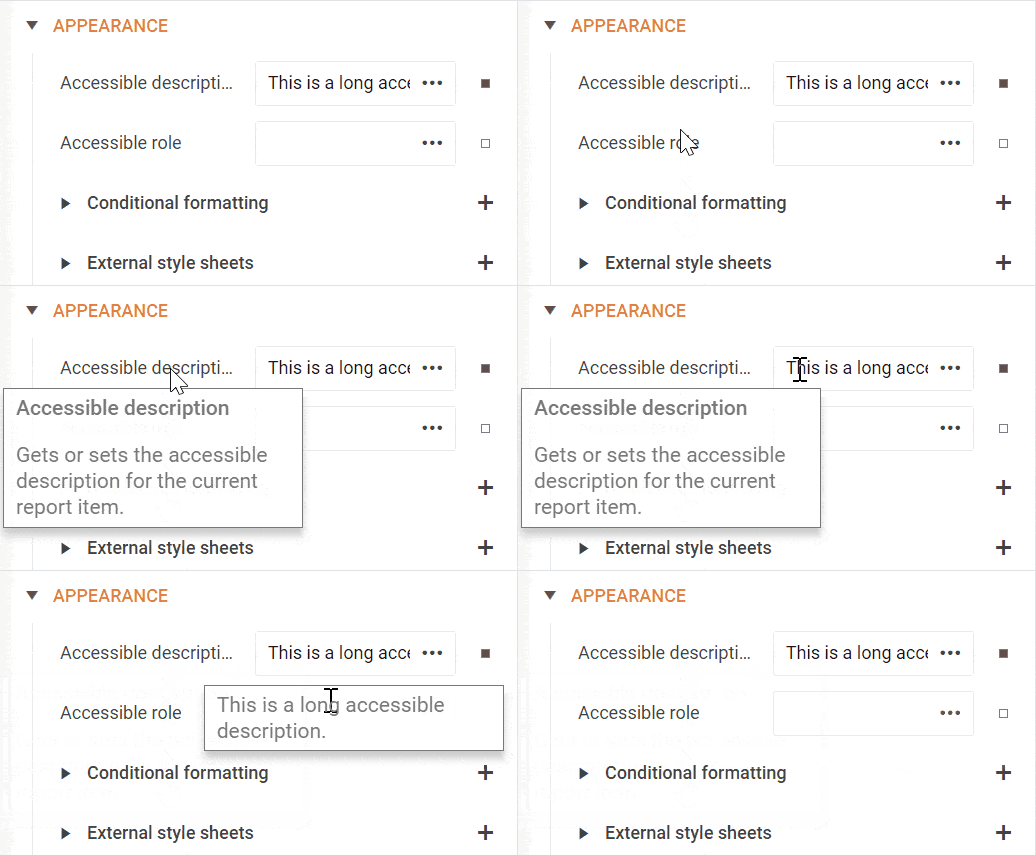
Another improvement we introduced to further help with orientation among the considerable number of editors in the properties area is the tooltips. The properties area now has two kinds of them. The first kind of tooltip appears on hovering over the label of the editor and contains the name and description of the corresponding property. The description strings are the same as the descriptions in the Standalone designer.
The second kind of tooltip is responsible for showing the current property value. It appears on hover over the editor element containing its value. As this behavior can quickly become a nuisance rather than be helpful, this kind of tooltip appears only in case the editor is not large enough to accommodate its entire content.
We feel that with the contextual guidance of the tooltips the users will be empowered to work better, faster and more easily with the Web Report Designer.
Conclusion
We hope you are happy with the new improvements just as we are. I didn’t even get to the work we have done to better integrate the report preview functionality into the Web Report Designer.
If you have not had the chance to try out the Web Report Designer, you can check it out here: Web Report Designer Demo | Telerik Reporting or see a video here. We look forward to your feedback!
Want to Create Reports?
Telerik Reporting is a complete, easy-to-use and powerful .NET embedded reporting tool for web and desktop applications that supports: Blazor, ASP.NET Core, ASP.NET MVC, ASP.NET AJAX, HTML5/JS, Angular, React, Vue, WPF, WinForms and UWP.
Also available as a part of our Telerik DevCraft bundle, Telerik Reporting allows you to create, style, view, and export rich, interactive and reusable reports to attractively present analytical and any business data. Add reports to any business application through report viewer controls. Export the ready reports to more than 15 formats. Try it free for 30 days.

Anna Velcheva
Anna is a software developer for the Document Processing team at Progress. She has been with the company since 2013. When not working on products that make other developers’ lives easier, she enjoys computer games, books, nature and running after her kids.

