Deliver a Better User Experience by Using the Right Charts

Summarize with AI:
A cheatsheet for building better dashboards and a better user experience by pairing the right type of chart to the right type of data.
There are many chart types that we can use, but if we want to convey the information and the meaning behind the data, it is important to make sure that we use the right chart for the right type of data. Data Visualization is, in some respects, the most important part of data science. Dashboards and Charts are supposed to provide extra intelligence for a set of data, but that only happens if the data is presented in a visually effective way.
Data Visualization
Data visualization is the science of taking raw numbers and presenting them in a way that makes it easier to understand and interpret the data. Computers are great at processing lots of numbers, but humans use their senses to take in and understand what it actually means. The chief way we do that is through visual presentations. There are many ways to visually represent information, but the primary method is with charts and graphs. These can be extremely useful ways to present data and help the viewer easily understand it. Trends jump out at us when displayed correctly, correlations can be spotted easily, etc.
While we might lose easy access to individual data points, we can assemble them all together to understand what they mean. If we look at total murders in New York city, for example, we can see that in 2013 there were 332 murders. That is a lot, and certainly a horrible number if you were one of the 332 people murdered, but what can that tell us? Is that better or worse than the year before? How about the year before that? In fact, that was down quite a bit and the rate has been dropping from a peak in the early 1990s. But not every year, and some years saw an increase. Without being able to see the trend visually it would take time to analyze numerically what you can visualize quickly with the right chart.
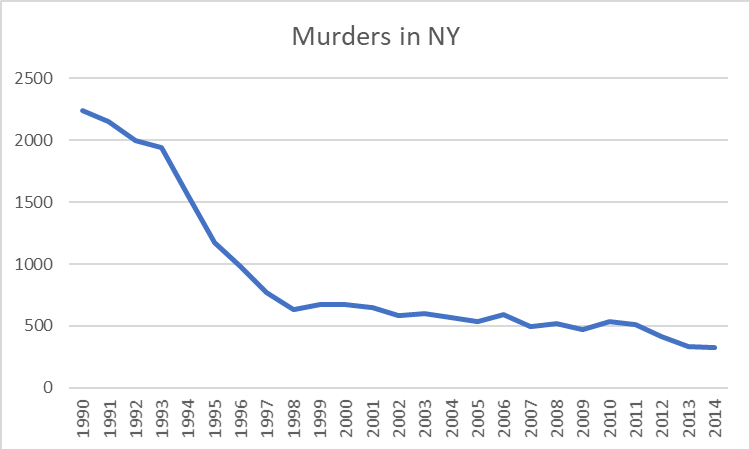
A line chart is the most common “go to” for data like this, but is it actually the best way to represent this data? There has been quite a bit of research on exactly how to best represent different types of data to make them easy to quickly understand. Let’s start out by examining and classifying the types of data we will work with.
Types of Data
First of all, let’s divide the data into discrete and continuous types.
Discrete data has individual, discrete values and there are no values in between. This could be something like shirt sizes. There is no value of shirt size that is in between a medium and a large.
Continuous values can have an infinite number of values in between each value. The number of miles a murderer has to travel away from New York before he feels safe from pursuit is a continuous value. It might be 3 miles, or 4 miles, or 3.14159 miles and so on.
Classifying data types can be a little fuzzy, and you may want to say “well yes but what about…” In our murder example, I would call the number of murders continuous and not discrete. It’s a count of something and the numbers vary over a wide range. You could argue, however, that it is discrete data because there is no such thing as a half of a murder victim. Some of the data types can be easily identified, and some take a little common sense. In the end you might need to compare two types of charts using the same data to more easily see where things belong.
Data Pairs
The next thing to consider as we select a chart is to consider the relationship between the data pairs themselves. In other words, what is the relationship between the X and the Y values? These are either Dependent or Independent. With a dependent relationship, the two values have a mathematical relationship such that for every X there is no more than one value of Y. This can be a mathematical formula where Y = F(X) where X is continuous, or just a list of values for each X where X is discrete. With an independent relationship, there is no direct relationship between X and Y. Inches of rain per day, for example, is in independent relationship despite the weather forecaster’s best efforts. For example,
- Dependent: [ { 1, y1 }, { 2, y2 }, { 3, y3 }…]
- Independent: [ { 1, y1 }, { 2, y2 }, { 2, y3 }…]
Chart Types
Now, let’s look at some common types of charts and see what characteristics they represent.
A Vertical Bar chart (aka a column chart) has a horizontal (X) value that represents discrete values, where each bar is a unique value or item. The vertical (Y) axis is dependent, and it is continuous. A horizontal bar chart has the same values but flipped sideways, so that the Y axis is now the discrete values and the X axis is now the continuous part.
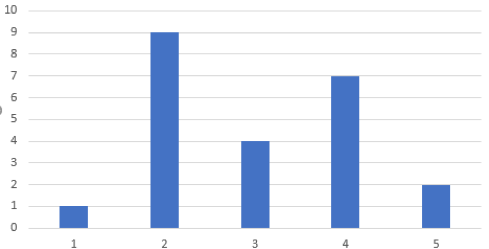
Bar Chart
A Line chart has an X axis that is continuous, and a Y axis that is a dependent and continuous.
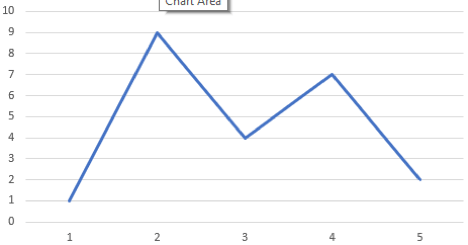
Line Chart
Scatter plots have an X axis that is a quantitative value, and a Y axis that is an independent quantitative variable. This relies mostly on position but clusters yield density as well. Markers, or “glyphs” are commonly used to indicate X axis positions where the data was actually sampled.
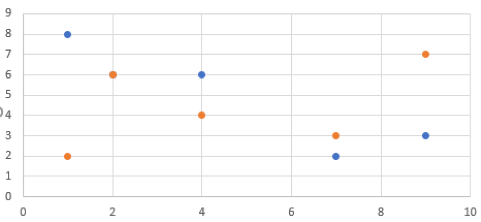
Scatter Plot
Gantt charts have an X axis that is continuous and a Y axis that is discrete, but also independent because unlike a bar chart you can have multiple segments for each bar. As with the bar chart, you can flip it 90 degrees and satisfy the need for a chart that has an X axis that is discrete and independent and a Y axis that is discrete.
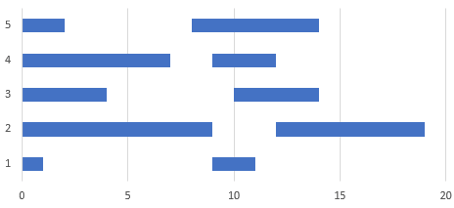
Gantt Chart
A Table is not always considered a real “chart,” but it is one nevertheless. A table has an X axis that is discrete and a Y axis that is also discrete. Whether the Y axis is dependent or independent doesn’t matter. With a discrete-discrete pair, your chart is now a grid and each cell is, at the most basic, either one or zero (or null). Of course we most commonly use a table to introduce a third dimension which we represent by a number in each cell.

Table
Let’s make a table of this and see what it looks like.
|
|
|
Horizontal (X) |
|
|
|
|
Discrete |
Continuous |
|
Vertical (Y) |
Dependent Continuous |
Bar (vertical) |
line |
|
Dependent Discrete |
table |
Bar (horizontal) |
|
|
Independent Continuous |
Gantt |
Scatter |
|
|
Independent Discrete |
table |
Gantt |
|
Now we have a quick and easy way to classify data types and see what kind of chart would be best to represent that data.
So about those murders…
So getting back to our murderous New York chart, was the line chart the right choice for us? The year is on the X axis and years are discrete values. Murders, on the Y axis, are dependent and continuous. For this type of data set a bar chart is listed as the best pick for such a chart, and we see this format below. Note that the individual years are now more prominently displayed, and we can clearly see that for each year there is only one value. We are not tempted to see how the murder rate progressed month by month by looking between the points on the line chart and it is clear that the data shows yearly totals only. The bar chart wins.
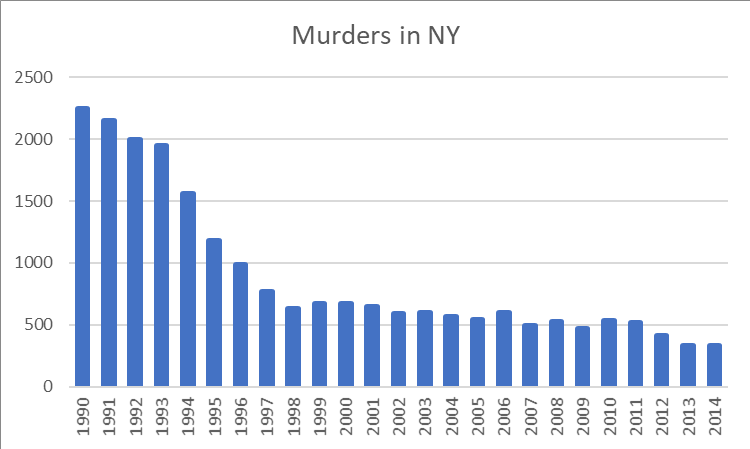
Source of data: https://en.wikipedia.org/wiki/Crime_in_New_York_City
Want to easily add sophisticated charts to your web apps? Check out our Kendo UI chart components.
Or, if you're looking for an easy way to generate effective visualizations and reports from your data, you may want to check out Telerik Reporting.

John Willoughby
John loves technology and because he just doesn’t get enough during the day, he also writes apps for fun as a hobby. He has worked in various software development and product marketing roles at both hardware and software companies. John has a Bachelor's in Electrical Engineering (Computer Design) and is in the middle of his Master's in Computer Science. When not actually sitting in front of a monitor he enjoys playing guitar.
