Awesome Features of Our Reporting Engine

Summarize with AI:
What makes a reporting solution shine? We take you through the key features of Progress Telerik Reporting and how our solution solves your business challenges.
Reporting solutions are created with the purpose of quickly making data visualizations from various data sources for previewing, printing, sharing and archiving.
In this article, I will focus on some of the nifty features that make our Reporting solution shine when data visualizations are needed.
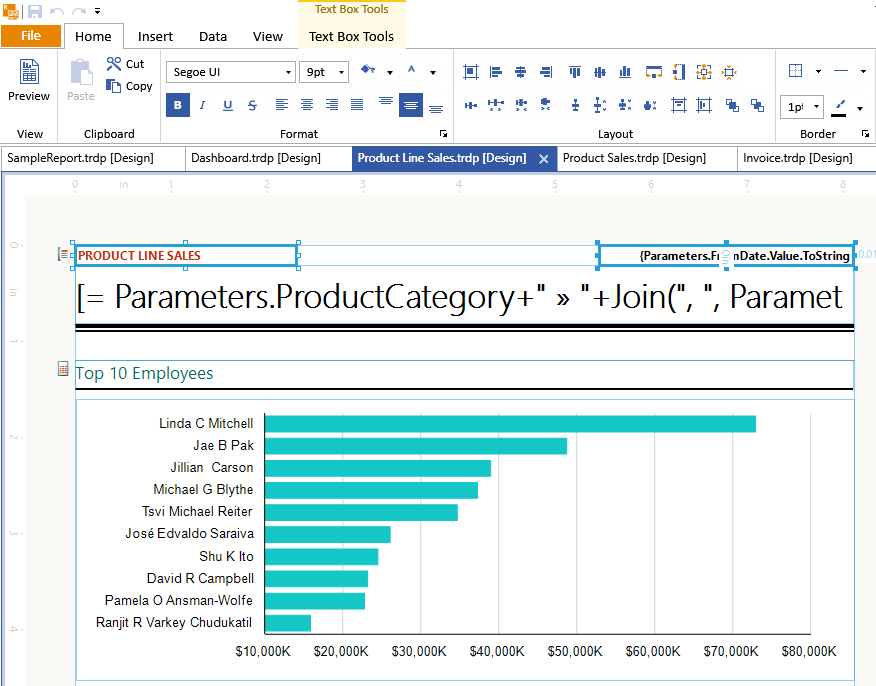
WYSIWYG Report Designers

Progress Telerik Reporting provides two report designers—a Standalone Report Designer for a code free report authoring experience, and a Report Designer embedded in Visual Studio for all die hard Visual Studio users. If you can't spare skilled developers to design and implement reports, you can use professionals with basic data operations and/or business understanding and utilize the easy to learn Standalone Report Designer. The designer is free, so a user that only authors reports will not require additional licensing.
Declarative Report Definitions
Report designers output a report definition. The declarative definition is one of the reporting advantages. Just as a programming language lets a programmer tell a computer how and what output to produce to the end user, the report definition tells the report engine what data to use and how to lay it out.
Now, there is a little trick: Most programming languages define the what and how of doing something. The report definition describes what the output will look like and where the source data is coming from. This leaves the application free to decide how to generate the defined look and feel, regardless of the programming language or underlying architecture. This is a declarative model. The benefit is that you get an easy coding free option to create complex and beautiful reports with a data driven report layout.
Data Items

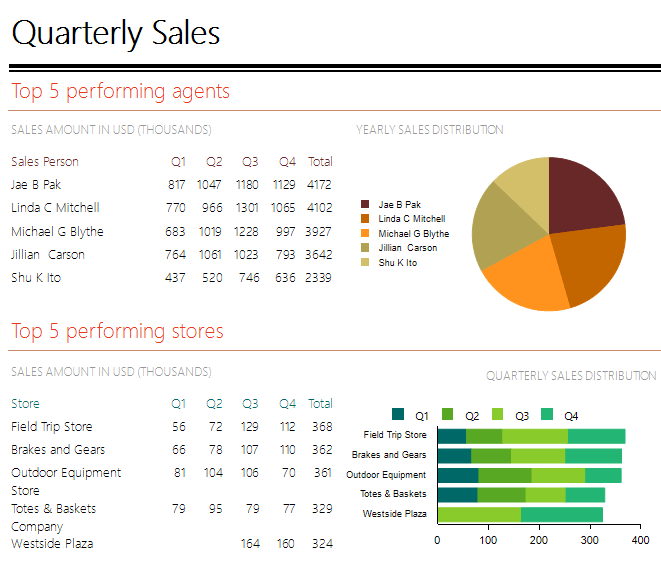
Reporting supports both the band reports paradigm and separate data items such as Graph (Chart), Crosstab (Pivot), Table and List items. This is combined with the flexible report data binding and with powerful grouping/sorting/filtering expressions. The reporting handles all data scopes generation and the corresponding data presentation repetition for you, making it much easier to produce analytical, master-detail, form reports or whatever your data visualization need is.
Nested Data Items
Telerik Reporting fully supports nesting data items. That means you can nest any data item in a table cell or report section. After you have created your impressive layout with nested data items, it's time to data bind them. Here you have two options—data bind to the parent item data context or bind with a data source component. The returned data rows from the data source component can be filtered based on the current data scope of the parent data item context. Based on the data item placement in a specific report band or in a crosstab/table cell, the binding will provide the appropriate data: detail data if the data item is in detail section, or table cell or grouped data for a group section or table cell representing a group.
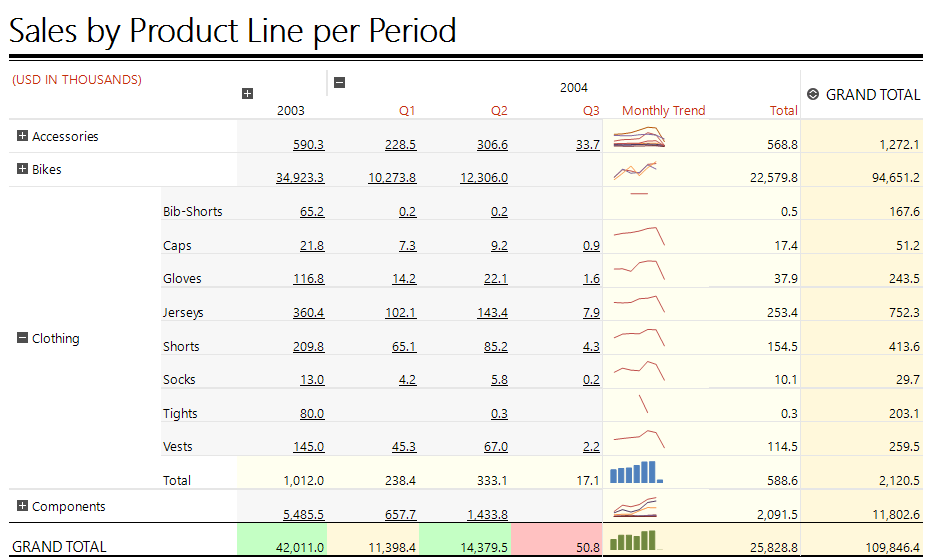
Nesting data items is very useful when you want to: combine detail and aggregate data with graphics in the form of Sparklines, Databars or full Charts. Present hierarchical data in the form of either static hierarchies and even dynamic hierarchies.
Present Data with Dynamic Hierarchies or Recursive Layout
Presenting data that is in a tree hierarchy with a random depth is one of the scenarios that shows the flexibility of Reporting. This is accomplished with the use of a self-referenced SubReport to achieve the recursive visiting on all the nested levels.
Reusability
Once defined, you can reuse the same report definition in any of the supported viewers/platforms without any modifications to the reports. The reporting engine will do all the heavy lifting and produce what's required by the platform output (HTML, XAML, EMF). Once reviewed in report viewer, the report definition can then be rendered in any of the popular document formats including PDF, XPS, Word, Excel, PowerPoint and so on.
Data and Styles in Unison for Great Reports

Reports don't have to mean ugly and boring data presentations. Instead, every mature reporting solution should offer not only granular and reusable CSS-like styling, but also data driven styling options like Reporting's conditional formatting and bindings. For further reading on the styling topic, consider the Beautiful Reporting whitepaper.
Telerik Reporting
Telerik Reporting is an embedded reporting solution that can be easily embedded in your application. For more information see: http://www.telerik.com/reporting.
Progress Telerik Report Sever

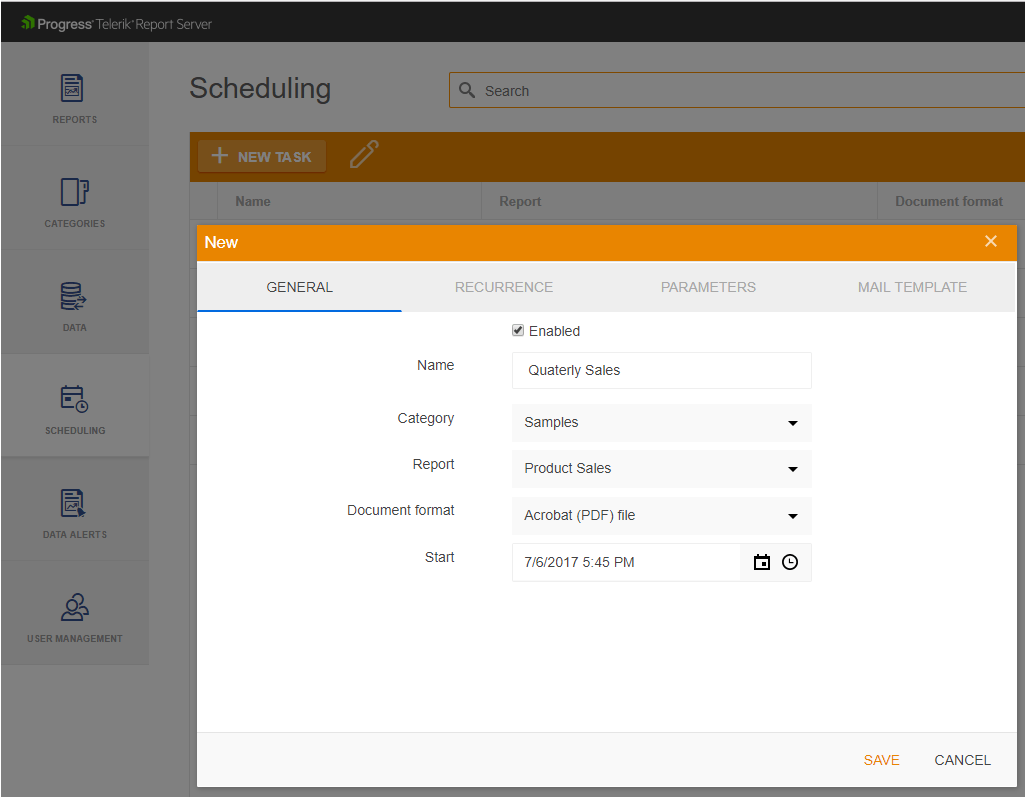
Managing a vast collection of reports may be challenging, and therefore we have introduced the Telerik Report Server solution to efficiently store, create and analyze reports in a single server-side repository. Report Server leverages the feature-rich Telerik Reporting engine and supports all must have report server features like scheduling, data alerts, versioning, report caching, authentication with AD FS support, ready to use report server web portal with enabled white labeling and complete REST API for integration with your desktop and web applications. For more information on the report server solution see: http://www.telerik.com/report-server
Try for Free Today
Are you excited to utilize the best reports for your apps? Start a free trial of Reporting and Report Server today.

Petar Raykov
Petar Raykov is a Software Developer in the Telerik Reporting division. He has been working on Telerik products since 2010. Off work he enjoys traveling, hanging out with friends and reading.
