Telerik Reporting
Customize .NET Reports Styling to Your Needs
- Design great reports with the help of perfect item positioning, CSS like styling with themes, conditional formatting and more
- Complete .NET embedded reporting tool for web and desktop applications
- Supports: Blazor, Angular, React, ASP.NET Core, ASP.NET MVC, ASP.NET Web Forms, HTML5/JS, WPF, WinForms and WinUI.
-
Perfect Positioning, Sizing and Aligning of Report Items
Telerik Reporting provides a WYSIWYG canvas in its report designers. The canvas simulates graph paper and implements techniques used in drawing software, such as gridlines, item snapping, item rotation and on-canvas item dimensions to simplify positioning and aligning report elements.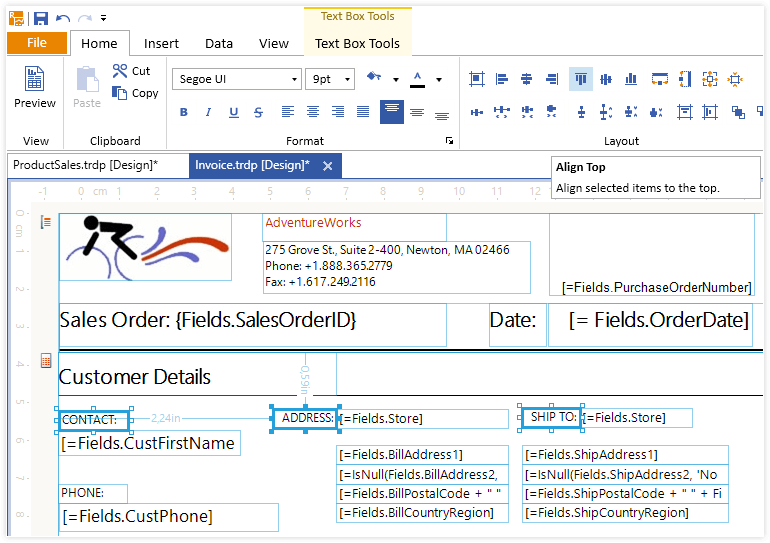
-
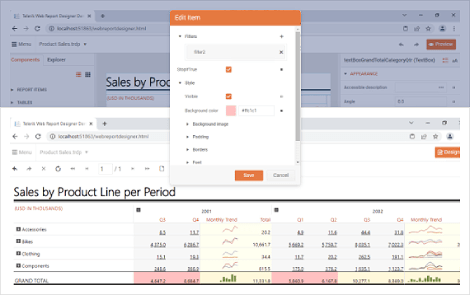
Format Reports Based on Data
The Telerik Reporting Conditional Formatting uses a powerful reporting expression engine with data conditions to control text color, font and background, much like Microsoft Excel.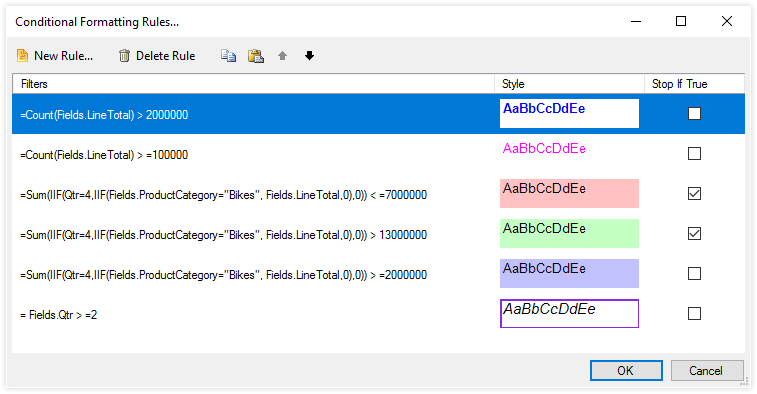
-
Powerful Styling with Copy and Paste
Telerik Reporting provides an advanced styling mechanism which closely follows CSS specifications. This model provides for quick, but detailed, visual customization of all your report items. You have full control over the item's visual properties. Styles can also be copied and applied to other items in a report.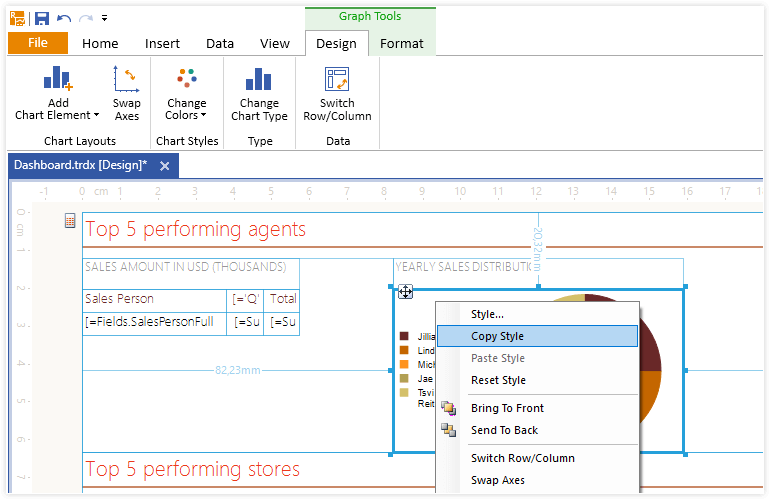
-
Use Any Currency, Set Any Date and Number Format
The Format Builder, an innovation introduced by Telerik, assists you in setting the proper formats for the dates, numbers and currency in your report, similar to the one in Microsoft Windows.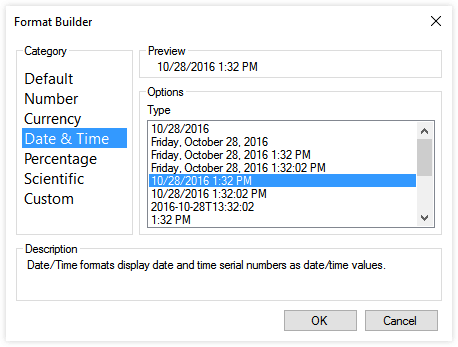
-
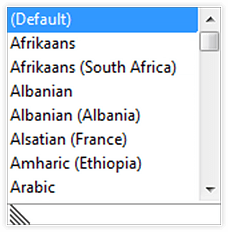
Report Globalization and Localization
Telerik Reporting is culture-aware and able to apply more than one set of cultural conventions to your reports. The culture determines how the date, time, numbers and currencies are displayed and specifies the appropriate text direction (LTR or RTL). All Telerik reports are localizable.