
Telerik Reporting
Embed Reports in Any Application
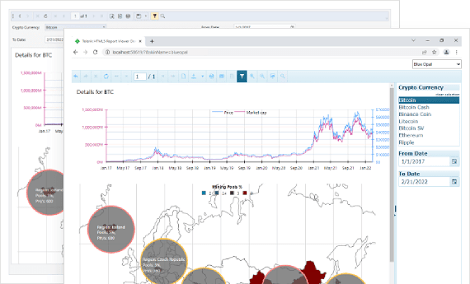
- Add reporting capabilities to any business application. View reports in web, desktop, and cloud integrating dedicated Report Viewer components. Export reports to multiple document formats.
- Complete .NET embedded reporting tool for web and desktop applications
- Supports: Blazor, Angular, React, ASP.NET Core, ASP.NET MVC, ASP.NET Web Forms, HTML5/JS, WPF, WinForms and WinUI.
-
Bring Interactive Reports to Your Users
Add drill-down and drill-through actions to your reports, insert a document map to jump to a report section and add hyperlinks to external web pages. These interactive features are available in all report viewers and designers. The HTML5 report viewer also offers screen-optimized touch capabilities.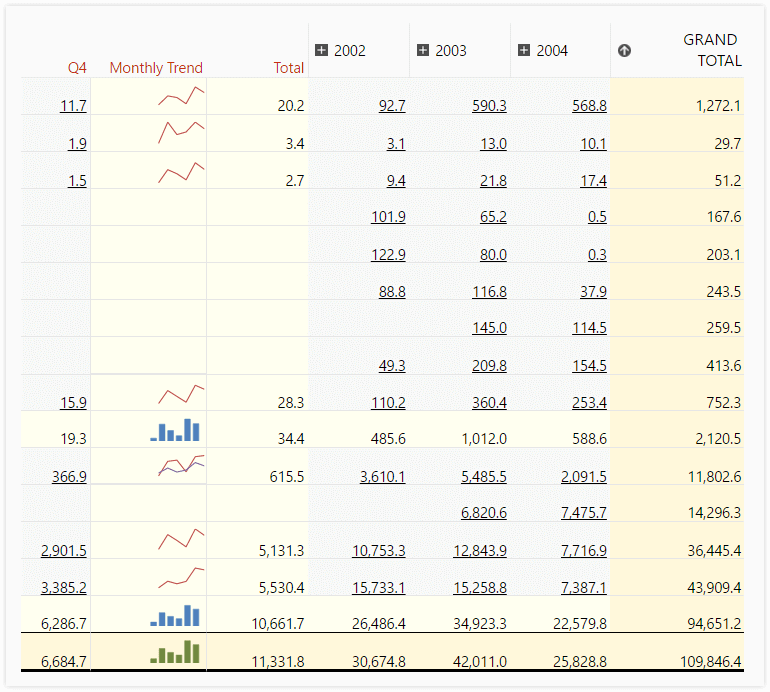
-
Filter and Sort Data at Run-Time
Add report parameters to customize the report data at run-time, filter, sort and group data interactively, connect related reports and sub-reports, modify data presentation, and even change report properties. -
Export to 15-Plus Formats
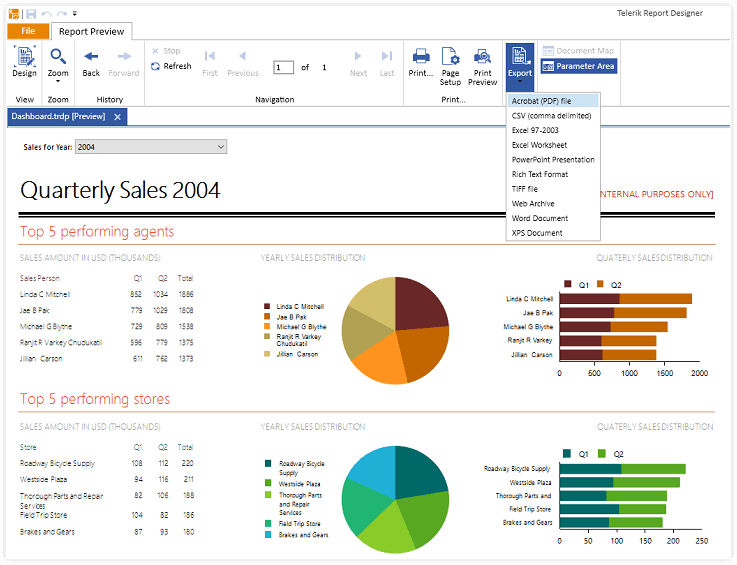
Export Telerik reports to the most common formats for further data analysis and report sharing:
- Microsoft Excel 97+ (XLS and XLSX)
- Microsoft Word 2007+
- Microsoft PowerPoint 2007+
- Adobe PDF
- MHTML
- Comma Separated Values (CSV)
- Rich Text Format (RTF)
- All image formats supported by GDI+ (JPEG, PNG, GIF, BMP, TIFF, etc.)
-
Print Reports
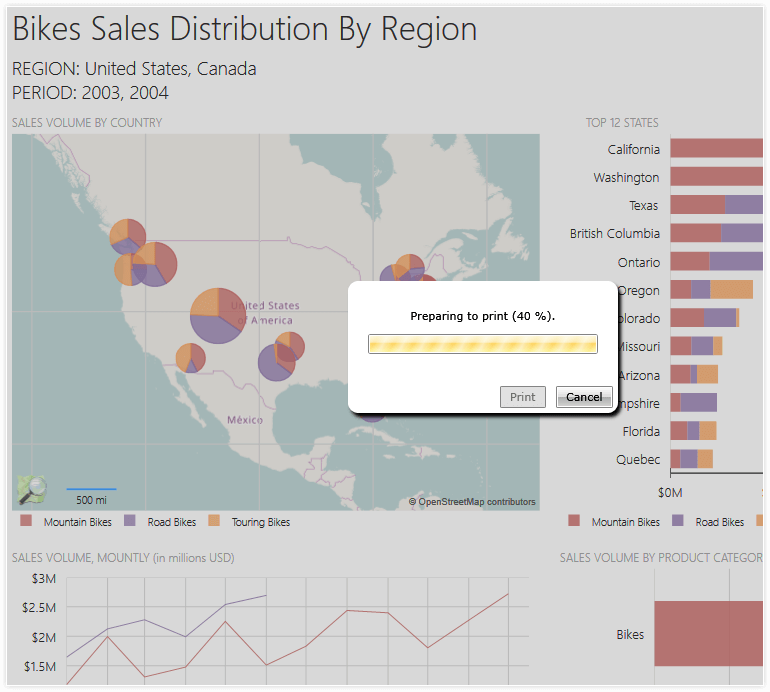
When you are ready to print or export, switch to Print Preview to view the report exactly as it would appear on paper. This functionality is provided in all report viewers and designers. True Printing through the ASP.NET and HTML5 viewers is also supported.
-
ReportViewer Themes
Telerik Reporting ensures nice integration in your application by supporting themes and skinning for all of its report viewers. You can choose to use the predefined themes, or create a new one.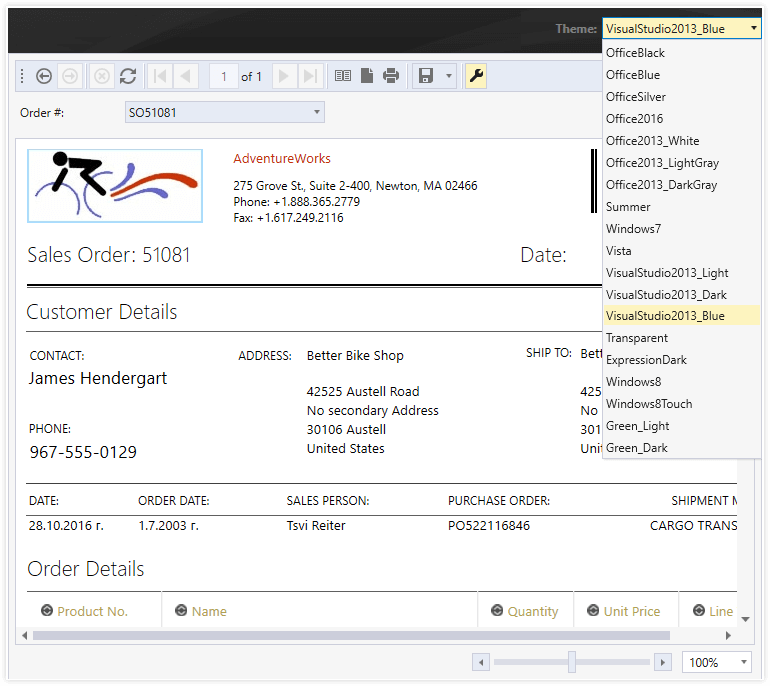
-
Web API and .NET API for Generating Report Documents
Our report generation APIs enable the utilization of the Telerik Reporting engine to export documents into any of the supported formats. By providing the report definition, parameters, and desired document format, developers can effortlessly generate reports. The .NET API is compatible with both .NET and .NET Framework applications, offering versatility. Similarly, the Web API, suitable for hosting within .NET or .NET Framework web applications, allows invocation from any client. Additionally, our .NET libraries support deployment across Windows and Linux platforms, whether on-premise or in the Cloud, ensuring flexibility.
-
ReportViewer Controls - Create Once, Deliver Everywhere
With Telerik .NET Reporting, you can deliver interactive reports directly to your web or desktop application. Reports can be viewed in ASP.NET Core, Blazor, ASP.NET MVC, HTML5, Angular, React, Vue, WPF, WinForms, WinUI, Azure Cloud, ASP.NET Web Forms and Touch Web Applications, where we aim for the same look and feel of the reports, regardless of the platform.
Blazor Reporting
Embed Telerik Reporting using a dedicated control called Native Blazor Report Viewer. It is implemented by composing Telerik UI for Blazor controls to offer a native user experience. The control blends with the rest of your application by using the same input controls and stylization mechanism.
Learn how to embed Reporting into your native Blazor applications.If you choose this embeddability option, you will need a Telerik UI for Blazor license on top of the Telerik Reporting license or the cost-effective Telerik DevCraft bundle license in place of the two single-product licenses.
Alternatively, use the Blazor Report Viewer (wrapper) which is a thin wrapper of the HTML5/JS jQuery-dependent Report Viewer. It is built on top of Kendo UI for jQuery and offers extensive JS modification APIs. Both viewers can be added to your application using a manual setup or dedicated Visual Studio item templates.
Angular Reporting
Similar to the Blazor support, there are two embeddability options for Angular applications. The Native Angular Report Viewer offers a native experience as it is built by composing Kendo UI for Angular components. If this components suite is used for the whole application the result will be a blending stylization of the reporting preview experience with the rest of the app functionality. This would additionally enable easy adoption of the company design system where needed.
Learn how to embed Reporting into your native Angular applications.Additionally, there is a Visual Studio Code extension automating the viewer integration. If you choose this control, you will additionally need a Kendo UI license or the cost-effective Telerik DevCraft bundle license instead of the two individual product licenses.
Alternatively, use the Angular Report Viewer (wrapper) which is an Angular wrapper of the original HTML5/JS jQuery-dependent Report Viewer. This viewer is built on top of Kendo UI for jQuery and offers extensive JS modification APIs.
HTML5 Reporting
The HTML5 report viewer control is an HTML/CSS/JS client-side widget, which does not require assembly references. It is suitable for any web application that works with JavaScript, including React and Vue.js applications.
Learn how to embed Reporting into your HTML5 applications.ASP.NET Core Reporting
ASP.NET Core Report report viewer combined with HTML5 report viewer is suitable for ASP.NET Core applications running on Windows, Linux and macOS.
Learn how to embed Reporting into your ASP.NET Core applications.ASP.NET MVC Reporting
The HTML5 ASP.NET MVC report viewer control allows you to configure the HTML5 viewer via server-side code. It renders the JavaScript viewer object and required scripts on the page and is suitable for ASP.NET MVC4/MVC5 projects.
Learn how to embed Reporting into your ASP.NET MVC applications.ASP.NET Web Forms Reporting
The ASP.NET Web Forms Report Viewer is a server-side wrapper around the HTML5 Report Viewer. It is designed to be used in new ASP.NET WebForms applications or as a replacement of the obsolete Telerik Reporting ASP.NET Report Viewer in existing applications.
Learn how to embed Reporting into your ASP.NET Web Forms applications.WPF Reporting
The WPF report viewer control is suitable for WinForms and WPF projects. It is built on top of our comprehensive WPF suite, so it supports their theming mechanism.
Learn more how to embed Reporting into your WPF applications.WinForms Reporting
The WinForms report viewer control is suitable for WinForms and WPF projects. It is built with standard Microsoft controls and can operate with an embedded reporting engine or as a client of the Telerik Reporting.
Learn more about Report Viewer Controls.WinUI Reporting
Telerik Reporting WinUI report viewer enables fast and easy embedding of reports that can be previewed directly into a WinUI application. The viewer is built using the Telerik UI for WinUI control suite to take advantage of the improved controls and be compatible with future themes.
With the native WinUI viewer users will be able to:
- Navigate the report pages for preview on the screen
- Exercise the defined interactivities like Navigate to another report or to a bookmark in the same one, drill-down or sort on a column, etc.
- Print or export the report to all the formats we support, including PDF and Excel
- Search the report contents to easily find particular data points
Learn how to embed Reporting into your WinUI applications.
React Reporting
Telerik Reporting React report viewer component ensures fast and easy embedding and preview of reports into a React web application. The viewer is built as a wrapper of the HTML5 Report Viewer widget, inheriting all its features, including:
- Navigate the report pages for preview on the screen
- Exercise the defined interactivities like Navigate to another report or to a bookmark in the same one, drill-down or sort on a column, etc.
- Print or export the report to all supported formats, including PDF and Excel
Frequently Asked Questions
-
What is Embedded Reporting?
Embedded Reporting makes it exceptionally easy for any business user to create, edit and visualize reports inside other business applications. The involvement of developers is kept minimal—just during the initial integration of reporting. Then, business users can take the helm. In a nutshell, embedded reporting saves time for developers and simplifies the overall process of data visualization for business users. Learn more.
-
How can I design a report?
You can easily create beautiful reports with one of the three WYSWYG report designers included in Telerik Reporting: Standalone Desktop Report Designer, Web Report Designer and Visual Studio Report Designer.
-
What is Visual Studio Report Designer?
The Visual Studio Report Designer offers a "What You See Is What You Get" (WYSIWYG) canvas for report generation, which allows users and developers to add and edit charts, tables, and other report items, style them, feed them with data and add calculations. Item rotation, in-line editing, report zooming, drag-and-drop data binding and a slew of additional features are also available directly in the report designer. To make the process of accurate positioning, aligning and sizing of report elements easy and intuitive, Telerik Reporting implements some techniques used in drawing software, such as gridlines, item snapping for perfect positioning, on-canvas item dimensions and report panning. Using this designer enables developers to handle events straight into the report definitions for maximum customization of the report.
-
What is Standalone Desktop Report Designer?
The Standalone Desktop Report Designer offers a "What You See Is What You Get" (WYSIWYG) canvas for report generation, which allows both users and developers to add and edit charts, tables and other report items, style them, feed them with data and add calculations. Item rotation, in-line editing, report zooming, drag-and-drop data binding and a slew of additional features are also available directly in the report designer. To make the process of accurate positioning, aligning and sizing of report elements easy and intuitive, Telerik Reporting implements some techniques used in drawing software, such as gridlines, item snapping for perfect positioning, on-canvas item dimensions and report panning.
-
What is Report Engine?
A report engine is a software component in reporting tool responsible for generating, formatting, and delivering reports based on input data and predefined templates or criteria. It acts as the backbone of reporting systems, handling the process of collecting, organizing, and presenting information in a structured manner. Report engines typically incorporate features such as data aggregation, filtering, sorting, and visualization to create comprehensive reports tailored to the needs of users. These engines often support various output formats, including PDF, Excel, HTML, and others, allowing flexibility in how the generated reports are consumed. Additionally, report engines may offer scheduling, automation, and distribution capabilities to streamline the reporting workflow and ensure timely delivery of information to report users.
-
What is Report Designer?
A report designer enables users to create, customize, and format reports from data stored in databases, spreadsheets, or other sources. This tool often provide a user-friendly interface with drag-and-drop functionality, allowing users to design the layout, structure and appearance of their reports. Report designers typically offer a range of features such as data filtering, grouping, sorting, and visualization options to help users present their data effectively.
Telerik Reporting is a reporting tool featuring 3 report designers - Visual Studio, Web and Desktop, countless wizards and drag and drop support.
-
How does Embedded Reporting work?
With Embedded Reporting developers will be able to simplify the workload by enabling their business users to easily create, edit and view reports on their own. The business users could use user-friendly Web report designer for report authoring and editing. Additionally, they could preview reports in web and desktop apps or print them. Learn more.
-
What is Web Report Designer?
The Web Report Designer is designed with the sole purpose of providing web report-editing capabilities to your web applications. It can be embedded in any web application—the only requirement is to host the accompanying REST Service in a .NET framework or a .NET Core application.
The Web Report Designer provides a design surface that allows the users to place, move and resize the report items in an easy and intuitive way. It preserves the most important features known from desktop designers like in-line editing, re-parenting through drag-and-drop or snapping to grid and snap lines. The report items representation utilizes Progress KendoUI widgets, ensuring silk-smooth user experience. The dedicated REST Service provides live preview for the complex report items, showing exactly how they will look when the report is rendered. Redesigned layout of the tool windows allows for easy navigations through the report items and their properties.
-
What are the benefits using Telerik Reporting?
Telerik Reporting a complete, lightweight, easy-to-use, and powerful .NET embedded reporting tool for web and desktop applications that supports: ASP.NET Core, Blazor, ASP.NET MVC, ASP.NET AJAX, HTML5, Angular, React, Vue, WPF, WinForms, WinUI. With Reporting tool any developer or reporting user will be able to create, style, view and export rich, interactive and reusable reports to attractively and beautifully present analytical and any business data. The reports can be added to any web and desktop business application through report viewer controls. The ready reports can be exported in more than 15 formats.
-
Where can I find Telerik Reporting examples and demos?
Telerik Reporting has handful sample demos, covering multiple reporting scenarios. The sample demos are designed to demonstrate the power of Telerik Reporting tool. You can review and play with them.
-
What is Web Reporting?
Web reporting refers to the practice of generating and presenting reports, data analyses, or visualizations through web-based platforms or applications. This approach allows users to access and interact with reports conveniently via web browsers, eliminating the need for specialized software or installations. It enables organizations to consume information quickly, collaborate remotely, and provide report users with real-time insights into various aspects of their business operations or projects.
-
What is the difference between Report Designer and Report Builder?
The difference between a Report Designer and a Report Builder lies primarily in their functionalities and target users:
Report Designer: This is typically a more advanced and feature-rich tool aimed at developers but also at their end users. Report designers often provide a comprehensive set of tools for creating complex and highly customized reports.
Report Builder: Report builders are generally designed for beginners who need to quickly create basic reports without delving into complex design or development processes.
Professional looking reports always require to be built with report designers. Telerik Reporting is a reporting tool featuring 3 report designers - Visual Studio, Web and Desktop, countless wizards and drag and drop support. Telerik Reporting enables report creation for both - developers and end users.
Why Choose Telerik Reporting
Enjoy a Complete Feature Set
Telerik Reporting lets you create, view and export rich, beautiful, interactive and reusable reports - everything a lightweight, feature-complete and embedded reporting tool should do.
Create Interactive Reports with .NET Report Designers
Create interactive embedded dashboards, invoices and more with the help of the Visual Studio, Standalone Desktop or Web WYSIWYG report designers, countless wizards and drag and drop support.
Customize .NET Reports Styling to Your Needs
Design great reports with the help of perfect item positioning, CSS like styling with themes, conditional formatting and more.
Deploy Reports to Any ReportViewer Control
Add reports to any business application. View reports in web, desktop and cloud apps. Export reports to any format (15+ supported formats).
OLAP Engine and Data Binding for Reporting
Deliver relevant information from any data source. Aggregate, filter and format data quickly and easily.
Embedded Reporting: Turn Users into Report Creators NEW
Simplify your workflow with an intuitive embedded reporting tool that enables your business users to easily create, edit and view reports on their own.
