ASP.NET Core Basics: Debugging in Visual Studio

Summarize with AI:
Debugging is an essential process for identifying and fixing errors in a web application. Check out this post for several tips for debugging in Visual Studio.
Debugging web applications is essential for identifying and solving problems, either in the code or in some external mechanism. When debugging an application, the developer can follow step-by-step the execution of the code, analyze variables, inspect stacks of calls, and identify possible errors and unexpected behavior, ensuring the quality and proper functioning of the application.
Visual Studio is the main tool for developing .NET applications and offers a wide range of features for debugging in ASP.NET Core, making the process more efficient and productive.
In this blog post, we’re going to create an application in ASP.NET Core and see what are the main functions available in Visual Studio for debugging and troubleshooting.
Visual Studio and the Integrated Debugger
Visual Studio is a powerful and widely used integrated development environment (IDE) developed and maintained by Microsoft. It offers a comprehensive set of tools and features to make creating, debugging and managing software projects easier.
In the context of ASP.NET Core, Visual Studio has a range of significant functionality for developing and debugging modern, scalable web applications.
Visual Studio’s built-in debugger is an essential tool for finding and fixing errors in ASP.NET Core apps. Through an intuitive interface, the integrated debugger allows developers to examine variables, follow the execution flow and identify complex problems in the code.
Building the Sample Application and Running Debug
Prerequisites
To create the application you need to have Visual Studio and the latest version of .NET. This post uses .NET 7, but .NET 8 is available now!
The debugger functions discussed in the post are only present in Visual Studio for Windows.
The source code of the application used in the example can be accessed here: TaskManager.
To create the application in Visual Studio, follow the steps below:
- Create a new project
- Choose ASP.NET Core Web API
- Choose .NET 7.0 (or 8.0)
- Uncheck the option to use controllers—we won’t need it in this example
- Name it “TaskManager”
- Click Create
Now let’s create a record that will represent the application’s entity, which in this case will be Tasks. Create a new folder inside the project called “Models” and inside that create a new class called “TaskItem” and replace the existing code with the code below:
namespace TaskManager.Models;
public record TaskItem(Guid Id, string Name, string Description, DateTime CreationDate, DateTime DueDate);
Now let’s create a service class to return some data. As the focus of the post is on debugging the application, we won’t use a database. Instead, the data will be mocked in the service class. In the root of the project, create a new folder called “Services” and in it create a new class called “TaskService.cs” and put the following code in it:
using TaskManager.Models;

namespace TaskManager.Services;
public class TaskService
{
  public List<TaskItem> FindTasks()
  {
    var taskList = new List<TaskItem>()
    {
      new TaskItem(
        Id: Guid.NewGuid(),
        Name: "Study ASP.NET Core",
        Description: "Study ASP.NET Core for 2 hours a day",
        CreationDate: DateTime.Now,
        DueDate: DateTime.Now + TimeSpan.FromDays(7)
      ),
      new TaskItem(
        Id: Guid.NewGuid(),
        Name: "Study ASP.NET Core",
        Description: "Clean the room at 4 pm",
        CreationDate: DateTime.Now,
        DueDate: DateTime.Now + TimeSpan.FromDays(7)
      ),
      new TaskItem(
        Id: Guid.NewGuid(),
        Name: "Submit Monthly Report",
        Description: "Submit the monthly sales report by the end of the week",
        CreationDate: DateTime.Now,
        DueDate: DateTime.Now + TimeSpan.FromDays(5)
      ),
      new TaskItem(
        Id: Guid.NewGuid(),
        Name: "Prepare Presentation",
        Description: "Prepare a presentation for the upcoming client meeting",
        CreationDate: DateTime.Now,
        DueDate: DateTime.Now + TimeSpan.FromDays(3)
      ),
      new TaskItem(
        Id: Guid.NewGuid(),
        Name: "Buy Groceries",
        Description: "Buy groceries for the week",
        CreationDate: DateTime.Now,
        DueDate: DateTime.Now + TimeSpan.FromDays(2)
      )
    };
  return taskList;
  }

  public TaskItem FindTaskByName(string name)
  {
    try
    {
      var taskList = FindTasks();
      var task = taskList.SingleOrDefault(t => t.Name == name);
      return task;
    }
    catch (Exception ex)
    {
      return null;
    }
  }
}
Note that in the code above we are defining two methods, one to return the complete list of tasks and the other returning a single task based on the given name. The next step is to add the endpoints that will access this data, so replace the Program.cs file with the code below:
using TaskManager.Services;

var builder = WebApplication.CreateBuilder(args);

// Add services to the container.
// Learn more about configuring Swagger/OpenAPI at https://aka.ms/aspnetcore/swashbuckle
builder.Services.AddEndpointsApiExplorer();
builder.Services.AddSwaggerGen();
builder.Services.AddScoped<TaskService>();

var app = builder.Build();

// Configure the HTTP request pipeline.
if (app.Environment.IsDevelopment())
{
  app.UseSwagger();
  app.UseSwaggerUI();
}

app.UseHttpsRedirection();

app.MapGet("/tasks", (TaskService service) =>
{
  var tasks = service.FindTasks();

  return Results.Ok(tasks);
})
.WithName("FindTasks")
.WithOpenApi();

app.MapGet("/tasks/{name}", (TaskService service, string name) =>
{
  var task = service.FindTaskByName(name);
  return task is null ? Results.NotFound() : Results.Ok(task);
})
.WithName("FindTaskByName")
.WithOpenApi();

app.Run();
Now, make sure that in the “Solution Configurations” tab “Debug” is selected. Run the project by clicking on the start icon in Visual Studio:
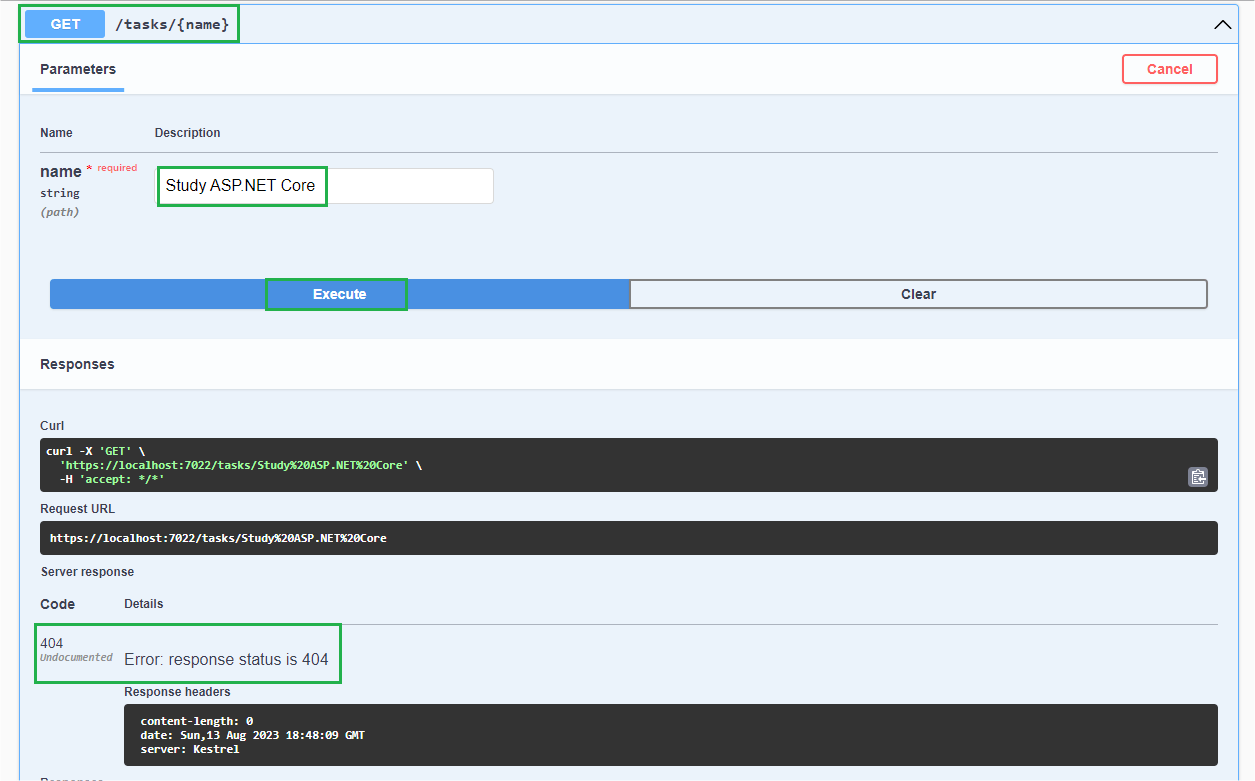
Then, in your browser, access the address https://localhost:[PORT]/swagger/index.html and execute the second endpoint, passing the following in the “name” parameter: Study ASP.NET Core, as shown in the image below.
Note that the result will be an HTTP status 404, this means that there was an error fetching the data. To find out what the error was, let’s debug the application.
Debugging and Finding the Error
To find the error, let’s follow the steps of executing the application. For that, let’s set a breakpoint where the exception occurs. Then, in the “TaskService.cs” class, in the line where the exception occurs, click in the corner of the Visual Studio tab to set the breakpoint, as shown in the image below:
Breakpoints are a debugging feature. You can set breakpoints where you want Visual Studio to pause your running code—that way you can observe variable values or unexpected behavior.
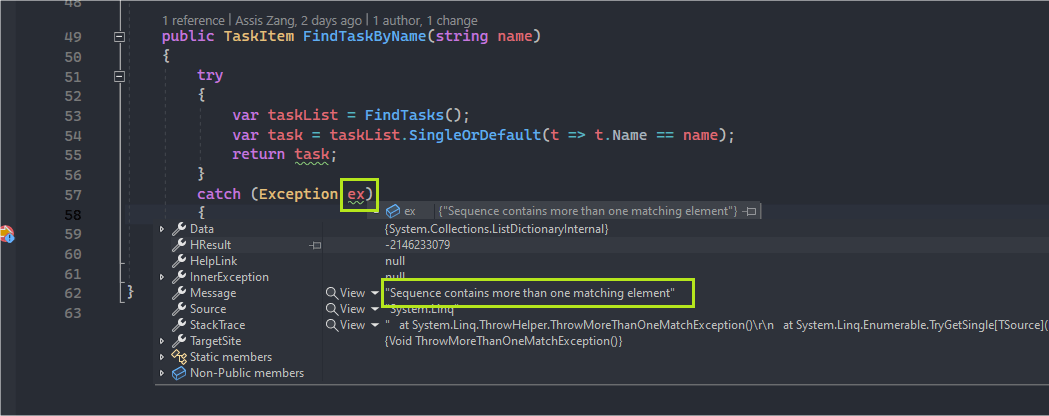
Now rerun the swagger endpoint passing the Study ASP.NET Core parameter. Then open Visual Studio and see that the execution was stopped at the breakpoint, and if you click on the “ex” variables and expand it you will be able to
see its value, which in this case is the error we are looking for:
Note that the exception is saying the following: “Sequence contains more than one matching element.” This means that we are filtering a single item through the “SingleOrDefault()” method in the task list, but more than one was found. This happened because the first two tasks have the same name. To solve the problem just change the name of one of the two.
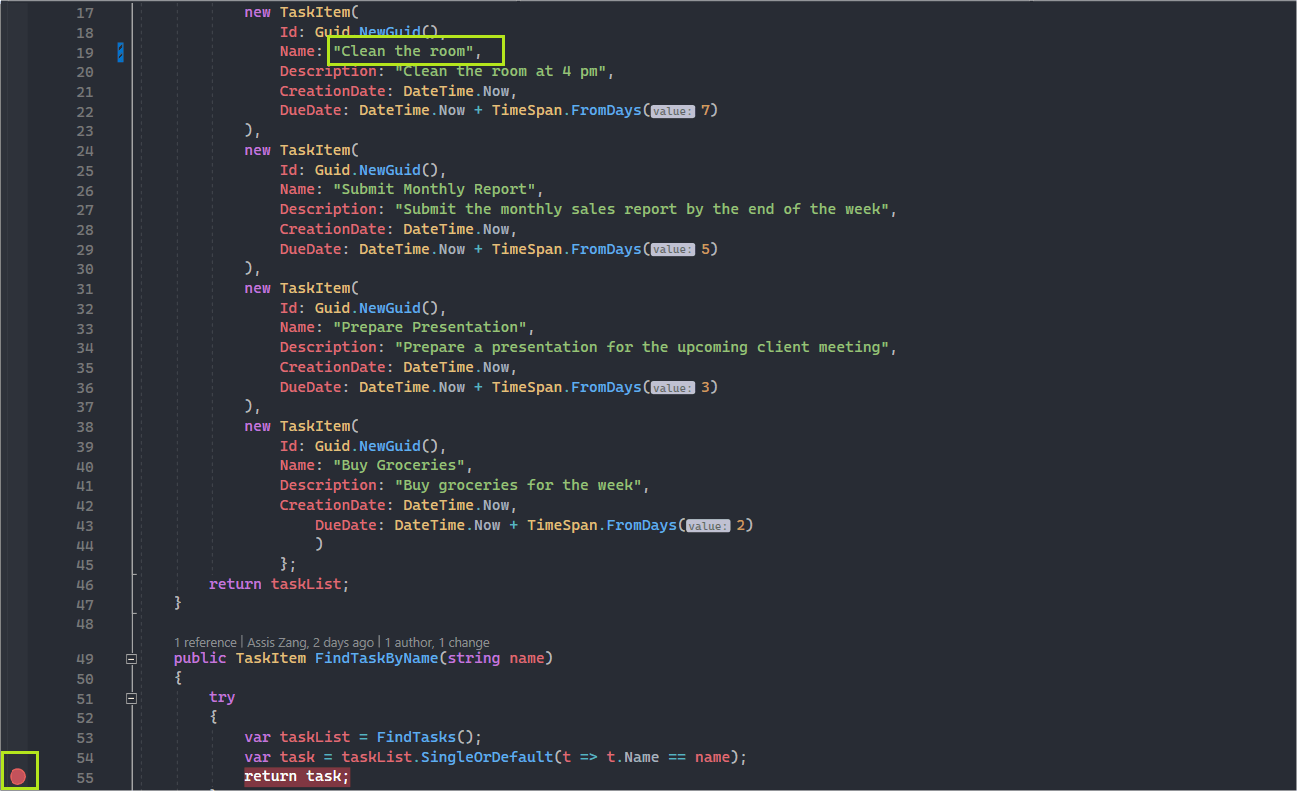
Then stop the debugger and change the name of the second task with the text “Clean the room,” then add another breakpoint where the variable “task” is returned as shown in the image below:
Then run the debugger and the endpoint in Swagger again. Notice that the debugger paused on the breakpoint before the exception. Now if you hover the mouse cursor over the task variable, you will see that the record with the name “Study ASP.NET Core” was successfully found and will be returned on the endpoint.
Navigating Through Code
Visual Studio’s debugger lets you navigate between breakpoints and through lines of code through an intuitive interface. To test these functions, add the following method above the second endpoint code in the Program.cs file:
static bool ValidateTaskName(string name)
{
    var userValid = true;

    if (name.Length < 3)
        userValid = false;

    return userValid;
}
And in the second endpoint add the call to the validation method:
       if (!ValidateTaskName(name))
            return Results.BadRequest("The name must have at least 3 characters");
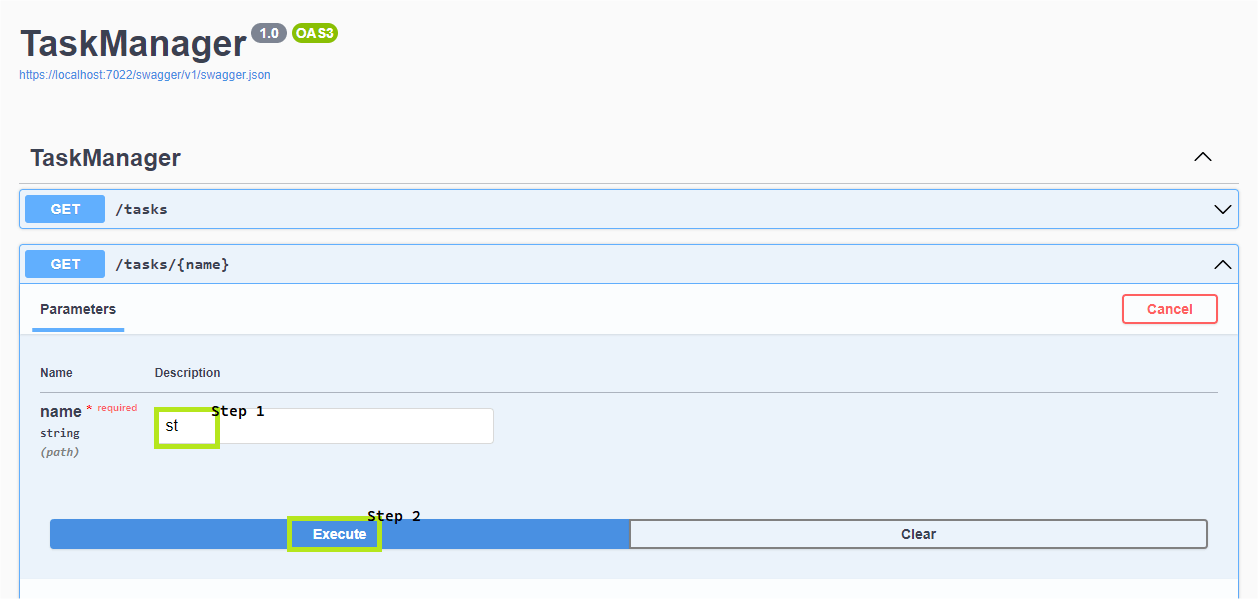
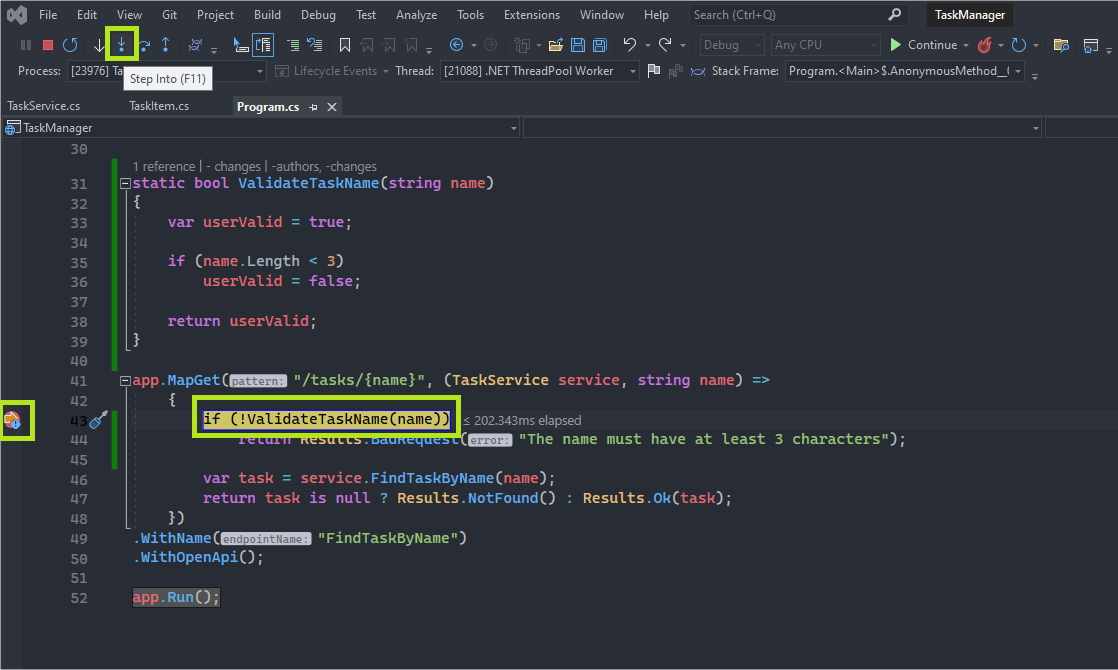
Then add a breakpoint on the “ValidateTaskName()” method call inside the second endpoint, and then start the debugger again, then in the Swagger interface, on the second endpoint, add the text st in the name field and click
run:
In Visual Studio, click on the icon that represents a down arrow. This will make the debugger’s cursor enter the “ValidateTaskManager()” method:
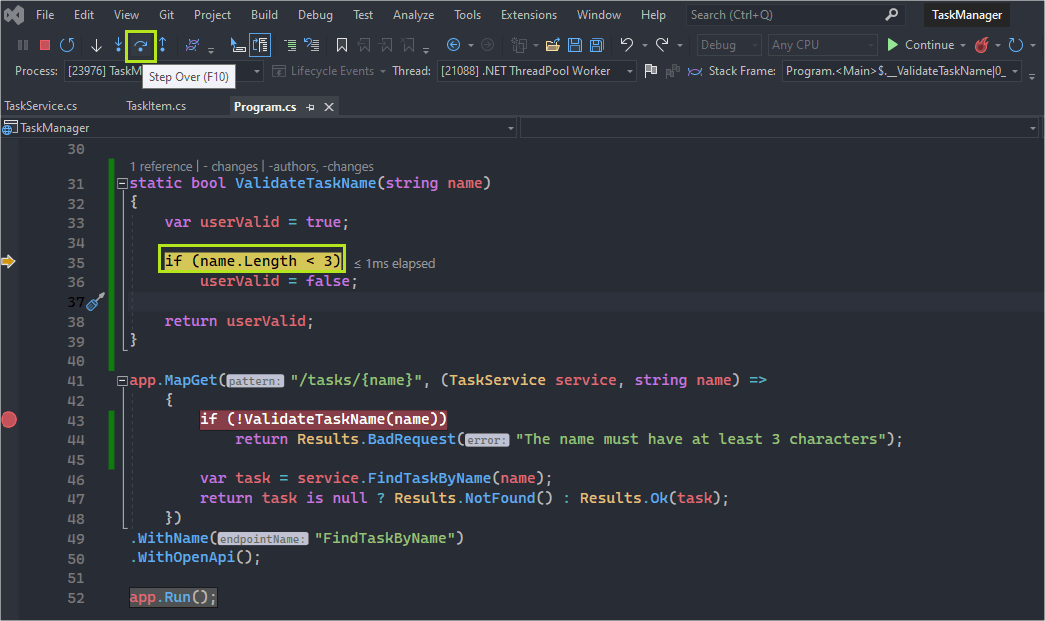
Then click on the icon with a curved arrow facing to the right. This will make the debugger’s cursor move to the next line. That’s how we navigate through the code through the debugger:
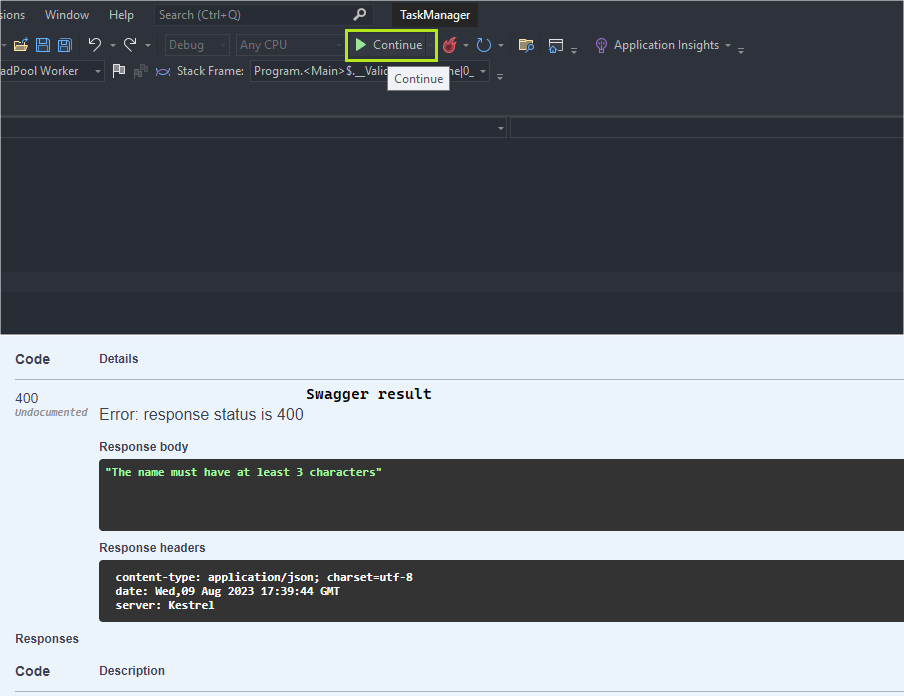
To finish the execution, click on the start icon that has the name “continue.” This function is used to jump straight to the next breakpoint. As we don’t have any more settings, the debugger will execute the rest of the code all at once.
Skip Code While Debugging
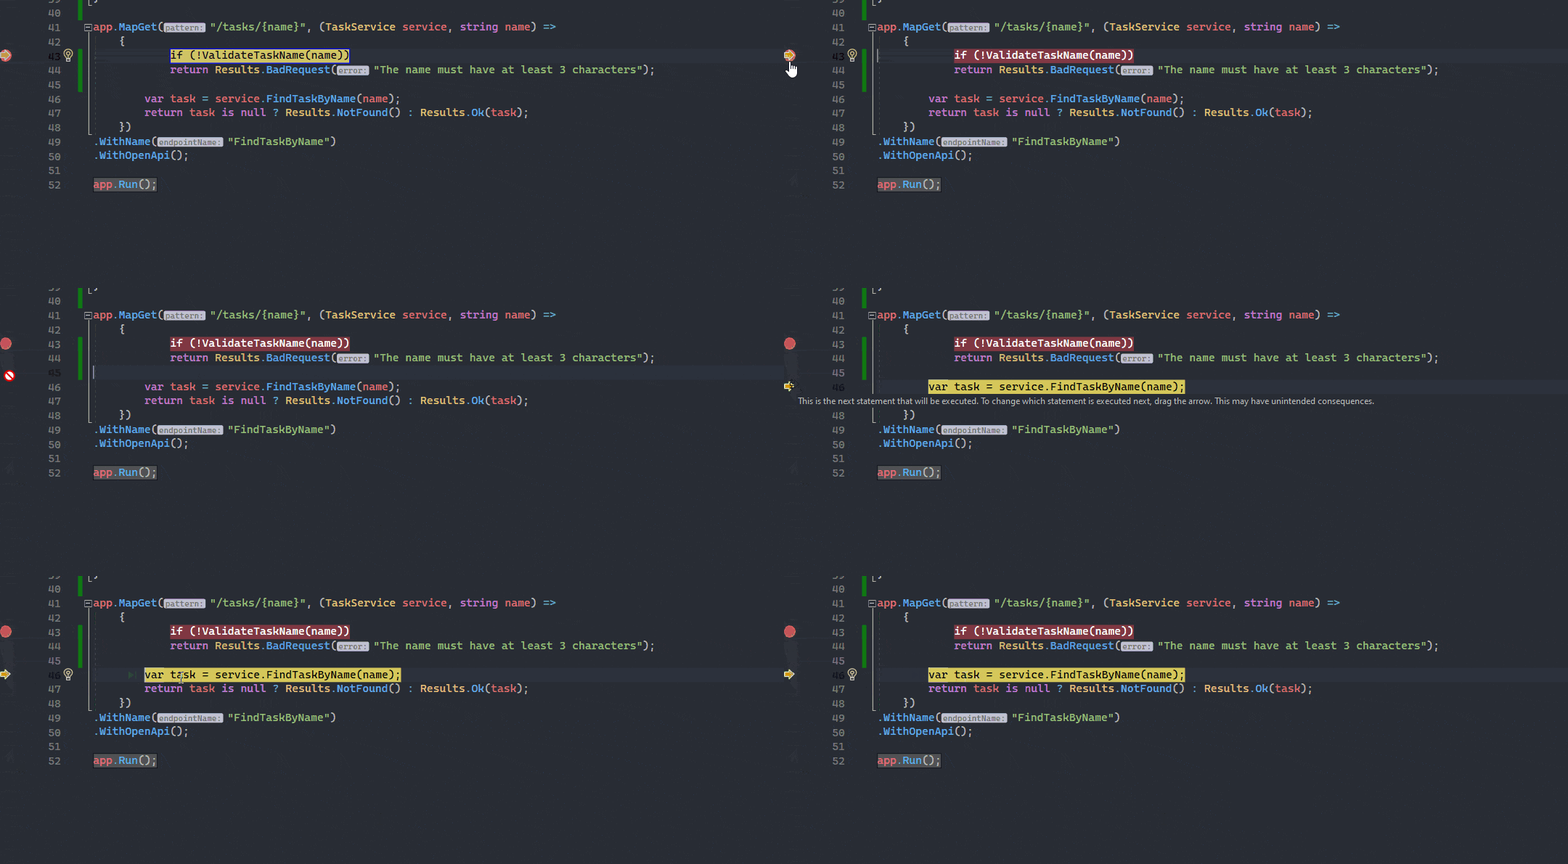
Through the Visual Studio debugger, it is possible to skip code snippets during debugging. Just position the mouse cursor over the debugger cursor and drag it to the desired area. This way it is possible to ignore validation methods, for example, without the need to comment or delete them. The GIF below demonstrates how to do this:
Inspecting Variable Values
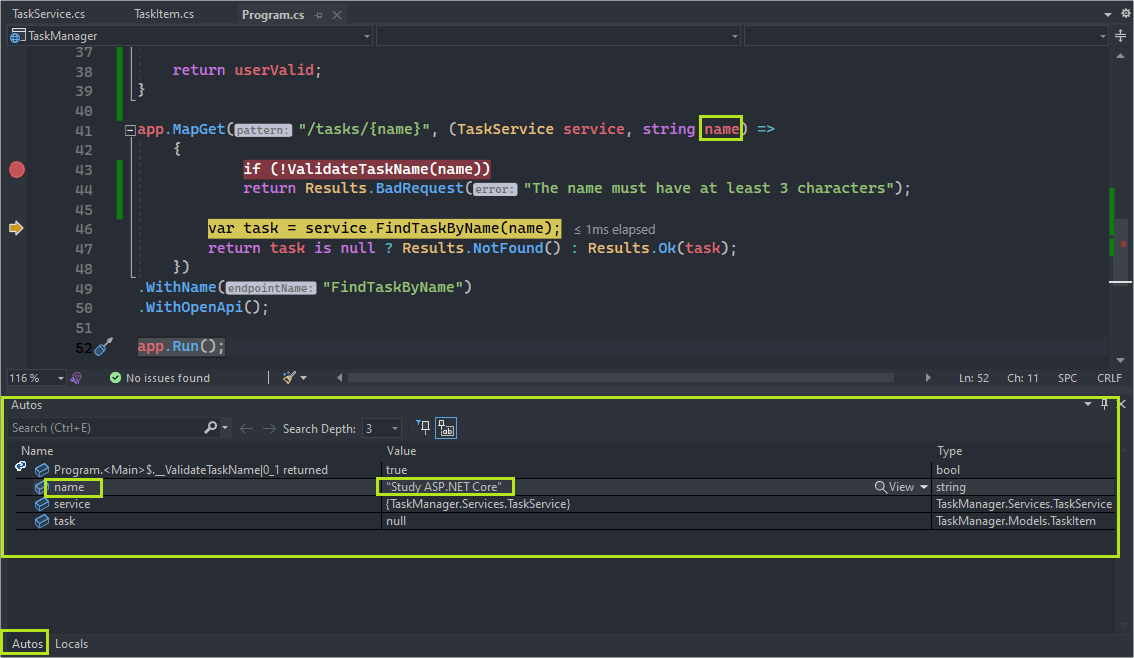
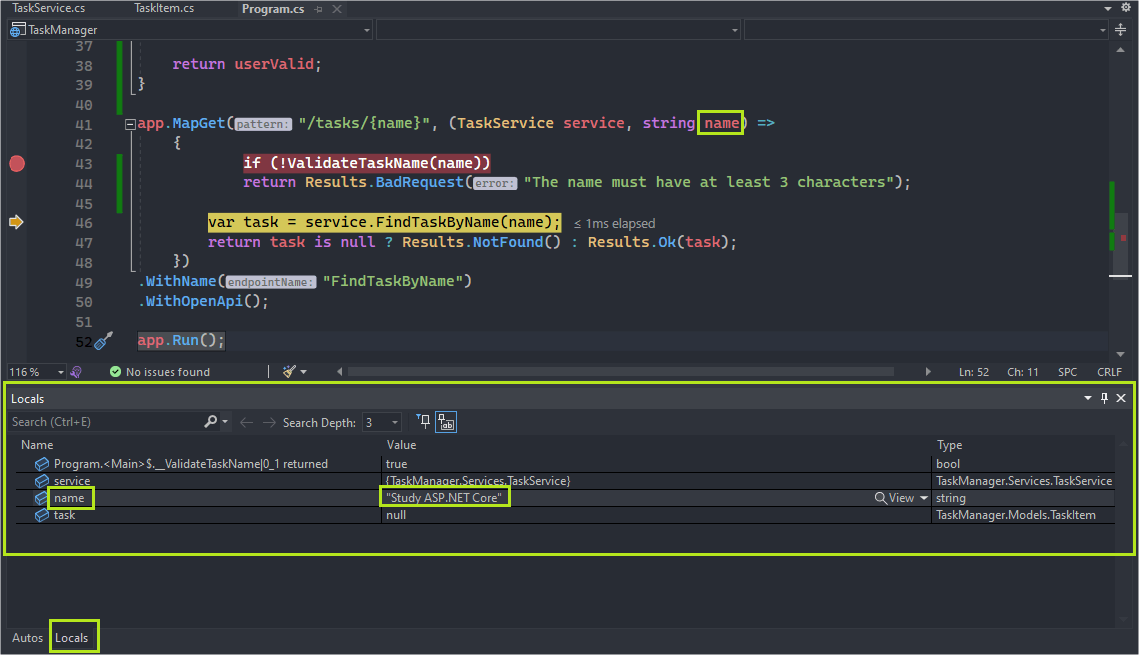
The debugger has functions for inspecting variable values through the Autos and Locals windows. The Autos window shows the variables used in the current line the debugger cursor is on and also in the previous line. The Locals window shows variables defined in the local scope, which is usually the current method or function.
Run the debugger, resubmit the text “Study ASP.NET Core” on the second endpoint, and look in Visual Studio at the Autos and Locals windows.
To access them, in Visual Studio select “Debug>Windows>Autos” from the menu bar for the Autos window and “Debug>Windows>Locals” for the Locals window. The images below show the windows during debugging.
Tracking a Variable
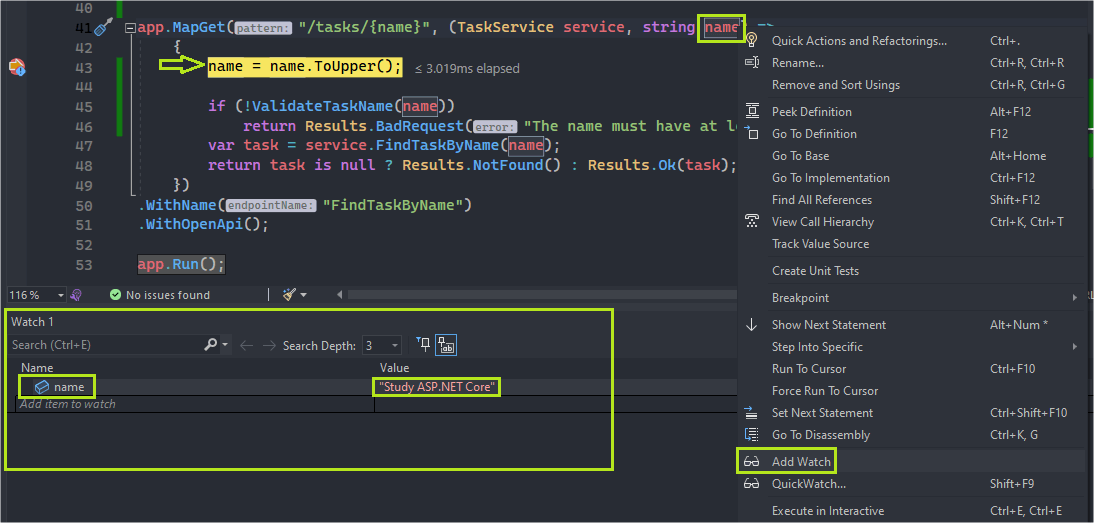
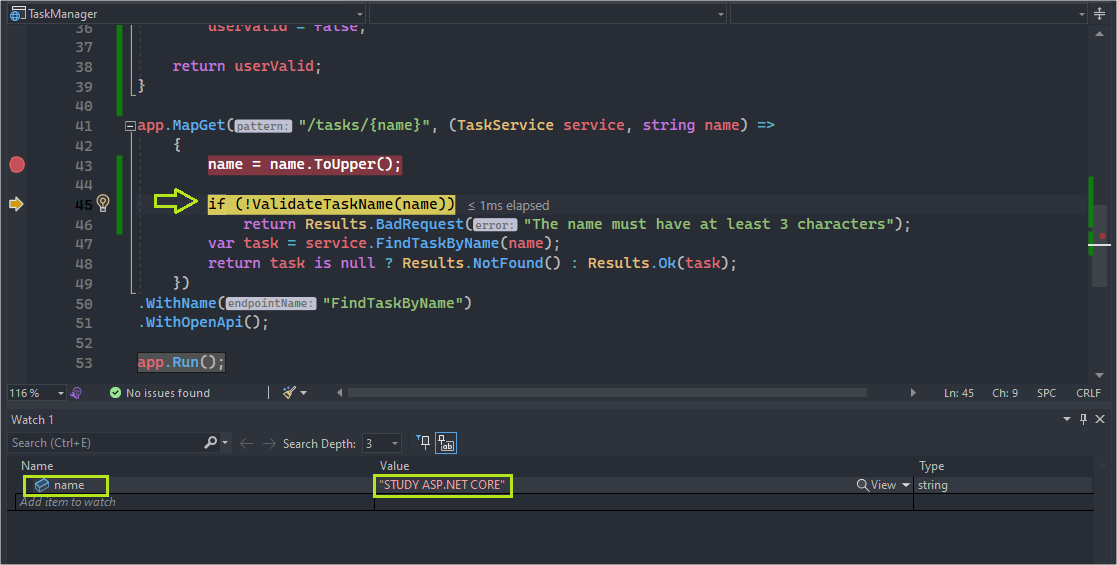
You can track a variable or expression while debugging by adding it to the Watch window.
To verify this function, add this code snippet:
name = name.ToUpper();
to the first line inside the second endpoint, then, with the debugger running, right-click on the variable name and choose Add Watch.
The Watch window will appear by default at the bottom of the code editor, so step through the code to see the value of the name variable change after going through the added code snippet, as shown in the screenshots below:
Tracing the Debug Flow with the Call Stack Window
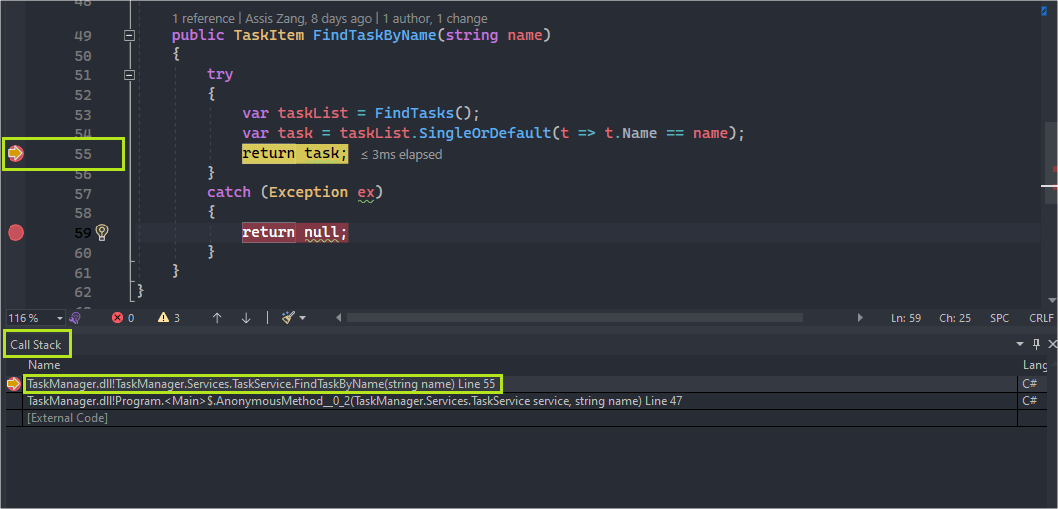
Another important feature of the Visual Studio debugger is the call stack window, which allows a better understanding of the application’s execution flow, showing the order in which methods and functions are being called.
To check the call stack window, start the debugger and open the call stack window from the Visual Studio menu: Debug>Windows>Call Stack. Step through the code through the endpoints. The method calls plus other details like the line where the code is will be displayed in the call stack window as in the image below.
Debugger Shortcut Keys
Visual Studio provides several shortcut keys to help you navigate and control the debugger efficiently. Below are some commonly used debugger shortcut keys:
- F5: Starts debugging (or continues if paused).
- F10: Step over – Executes the current line of code and moves to the next line, but does not delve into any function called on that line.
- F11: Step into – Runs the current line of code and moves to the next line, stepping into any function called on that line.
- Shift + F11: Exit – Continue execution until the current function returns and control returns to the calling function.
- F9: Toggle Breakpoint – Set or remove a breakpoint on the current line.
- Ctrl + F5: Start without debugging – Run the program without attaching the debugger.
- Ctrl + F10: Run to cursor – Continue execution until the current cursor position is reached.
- Ctrl + F9: Clear All Breakpoints – Removes all breakpoints from the current document.
- Ctrl + Shift + F9: Disables all breakpoints – Temporarily disables all breakpoints.
- Ctrl + Alt + P: Attach to Process – Opens the “Attach to Process” dialog to attach the debugger to a running process.
- Ctrl + Alt + Q: Quick Watch – Open the Quick Watch dialog to inspect the value of an expression.
- Ctrl + Shift + F5: Restart Debugging – Stop debugging and restart the debugging session.
- Ctrl + Shift + B: Build – Build the solution (not a debugging action, but often used in conjunction with debugging).
- Shift + F5: Stop debugging – Terminate the debugging session.
- Ctrl + K, Ctrl + C: Comment out selected lines of code.
- Ctrl + K, Ctrl + U: Uncomment selected lines of code.
- Ctrl + ]: Navigate to the closing brace of the current code block.
- Ctrl + [: Switch between Autos, Locals and Watch windows.
These shortcut keys may vary depending on the version of Visual Studio you are using and any customizations you may have made. You can also view and customize shortcut keys by going to Tools > Options > Environment > Keyboard in the Visual Studio menu.
Conclusion
Visual Studio is a formidable tool for developing and debugging ASP.NET Core applications. Through the Visual Studio debugger, it is possible to find bugs quickly by inspecting values of variables and other objects, following the process execution flow with the Call Stack window, in addition to several other resources.
In this post, we saw some of the main functions of the Visual Studio debugger and how to use them, so whenever you need to analyze a problem during development, consider using the advanced features of the debugger and increase your productivity even more.


