Understanding Wizard Values Data Table Tab
RadChart has been deprecated since Q3 2014 and is marked as obsolete as of the 2026 Q2 SP1 (v2026.2.708) release. This is the last release that includes the RadChart component — its source code will be removed from the assembly in the next release. We strongly recommend using RadHtmlChart, Telerik's modern client-side charting component. To transition from RadChart to RadHtmlChart, refer to the following migration articles:
Explore the RadHtmlChart documentation and online demos to determine how it fits your development needs.
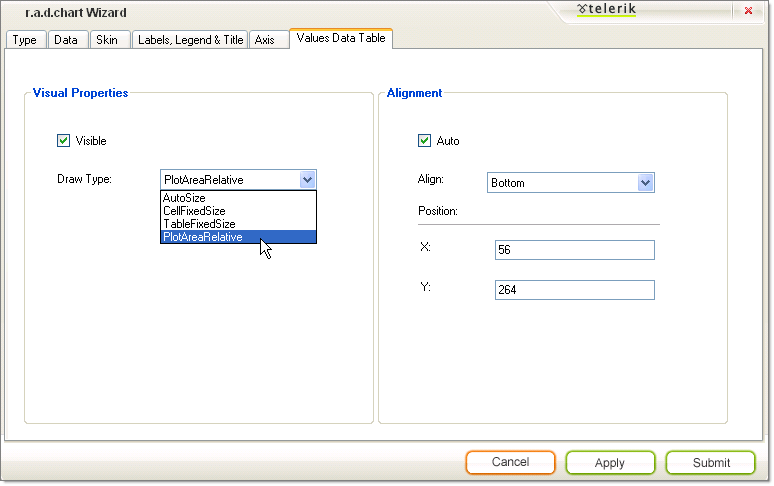
The Values Data Table tab of the Wizard controls the general look and positioning of the chart data table.
Visual Properties
-
Check Visible to display the chart data table. By default this is unchecked.
-
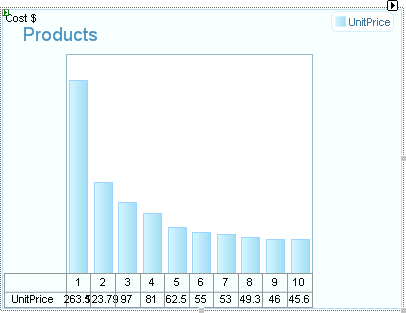
Select Draw Type from the drop down list to control the general size and positioning of the chart. Select AutoSize to have each cell size to the data inside of it.PlotAreaRelative places each cell just below the chart series item it represents. CellFixedSize and TableFixedSize fix the size of the cells or table irrespective of the data it contains.
Alignment
Use the Align drop down list to place the chart data table in a predefined position (e.g. Top, Bottom, BottomRight, etc.)To place the data table at exact coordinates, uncheck Auto and enter values for X and Y.